Preprocessing the CCD images#
Software |
Version |
|---|---|
Python |
3.12.2 64bit [Clang 14.0.6] |
IPython |
8.20.0 |
OS |
macOS 13.4.1 arm64 arm 64bit |
numpy |
1.26.4 |
scipy |
1.11.4 |
matplotlib |
3.8.0 |
astropy |
5.3.4 |
ccdproc |
2.4.1 |
photutils |
1.11.0 |
%config InlineBackend.figure_format = 'retina'
import numpy as np
from pathlib import Path
import re
import time

from astropy.io import fits
from astropy.table import Table
from astropy.visualization import ZScaleInterval
from astropy.nddata import CCDData
import astroalign as aa
from ccdproc import combine
from matplotlib import pyplot as plt

plt.rcParams['font.size'] = 12
plt.rcParams['axes.labelsize'] = 14
# setting locations
DATADIR = Path('./data/reduc/2024-03-20')
RAWDIR = DATADIR / 'raw'
OUTDIR = DATADIR/ 'reduced'

# making output directory if it doesn't exist
if not OUTDIR.exists():
    OUTDIR.mkdir()
def make_summary_table(rawdir: Path):
    # making a summary table
    summary = []
    for f in rawdir.glob('*.fit'):
        hdr = fits.getheader(f)
        # getting the filter information
        filt = 'unknown'
        if 'filter' in hdr:
            filt = hdr['filter']
        elif 'FILTER' in hdr:
            filt = hdr['FILTER']
        else:
        # - checking for the filter in the filename with regex, if not in header
            mtch = re.search(r'[UBVRIgriz].fit$', f.name)
            mtch_Ha = re.search(r'Ha.fit$', f.name)
            if mtch:
                filt = mtch.group(0)[0]
            elif mtch_Ha:
                filt = 'Ha'

        # getting the airmass X (Pickering 2002)
        try:
            alt = float(hdr['OBJCTALT'])
            X = 1/(np.sin(np.radians( alt + 244/(165 + 47*alt**1.1 ))))
        except TypeError:
            X = -1
        except Exception as e:
            print(f'Error in {f.name}: {e}')
            X = -1

        summary.append([f.name, hdr['DATE-OBS'], hdr['OBJECT'],
                        hdr['OBJCTRA'], hdr['OBJCTDEC'],
                        hdr['IMAGETYP'], hdr['EXPTIME'],
                        X, filt])

    stab = Table(rows=summary,
                    names=['filename', 'date-obs', 'object', 'ra', 'dec',
                        'imagetyp', 'exptime', 'airmass', 'filter'],
                    dtype=['U50', 'U50', 'U50', 'U50', 'U50', 'U50',
                        'f8', 'f8', 'U50'])
    return stab
# making the summary table
summary_table = make_summary_table(RAWDIR)
# sorting the table by date
summary_table.sort('date-obs')
# showing the table
summary_table.show_in_notebook(display_length=5)
Table length=60
| idx | filename | date-obs | object | ra | dec | imagetyp | exptime | airmass | filter |
|---|---|---|---|---|---|---|---|---|---|
| 0 | skyflat-0001Ha.fit | 2024-03-20T09:22:27 | skyflat | 07 43 57 | +60 34 21 | Flat Field | 3.0 | 1.152217579019225 | Ha |
| 1 | skyflat-0002Ha.fit | 2024-03-20T09:22:42 | skyflat | 07 44 13 | +60 34 21 | Flat Field | 3.0 | 1.1522164291076638 | Ha |
| 2 | skyflat-0003Ha.fit | 2024-03-20T09:22:57 | skyflat | 07 44 28 | +60 34 22 | Flat Field | 3.0 | 1.152217579019225 | Ha |
| 3 | skyflat-0004Ha.fit | 2024-03-20T09:23:12 | skyflat | 07 44 43 | +60 34 22 | Flat Field | 3.0 | 1.1522187289365808 | Ha |
| 4 | skyflat-0005Ha.fit | 2024-03-20T09:23:27 | skyflat | 07 44 58 | +60 34 22 | Flat Field | 3.0 | 1.1522187289365808 | Ha |
| 5 | skyflat-0006Ha.fit | 2024-03-20T09:23:42 | skyflat | 07 45 13 | +60 34 23 | Flat Field | 3.0 | 1.1522187289365808 | Ha |
| 6 | skyflat-0007Ha.fit | 2024-03-20T09:23:57 | skyflat | 07 45 28 | +60 34 23 | Flat Field | 3.0 | 1.152217579019225 | Ha |
| 7 | skyflat-0001i.fit | 2024-03-20T09:48:06 | skyflat | 08 09 43 | +60 35 08 | Flat Field | 2.0 | 1.1522187289365808 | i |
| 8 | skyflat-0002i.fit | 2024-03-20T09:48:20 | skyflat | 08 09 56 | +60 35 08 | Flat Field | 2.0 | 1.152219878859731 | i |
| 9 | skyflat-0003i.fit | 2024-03-20T09:48:34 | skyflat | 08 10 11 | +60 35 09 | Flat Field | 2.0 | 1.1522187289365808 | i |
| 10 | skyflat-0004i.fit | 2024-03-20T09:48:48 | skyflat | 08 10 25 | +60 35 09 | Flat Field | 2.0 | 1.1522152792018971 | i |
| 11 | skyflat-0005i.fit | 2024-03-20T09:49:02 | skyflat | 08 10 39 | +60 35 10 | Flat Field | 2.0 | 1.1522164291076638 | i |
| 12 | skyflat-0006i.fit | 2024-03-20T09:49:16 | skyflat | 08 10 53 | +60 35 10 | Flat Field | 2.0 | 1.1522164291076638 | i |
| 13 | skyflat-0007i.fit | 2024-03-20T09:49:30 | skyflat | 08 11 07 | +60 35 10 | Flat Field | 2.0 | 1.1522152792018971 | i |
| 14 | skyflat-0001r.fit | 2024-03-20T09:50:02 | skyflat | 08 11 39 | +60 35 11 | Flat Field | 2.0 | 1.1522187289365808 | r |
| 15 | skyflat-0002r.fit | 2024-03-20T09:50:16 | skyflat | 08 11 53 | +60 35 12 | Flat Field | 2.0 | 1.1522152792018971 | r |
| 16 | skyflat-0003r.fit | 2024-03-20T09:50:30 | skyflat | 08 12 07 | +60 35 12 | Flat Field | 2.0 | 1.1522187289365808 | r |
| 17 | skyflat-0004r.fit | 2024-03-20T09:50:44 | skyflat | 08 12 21 | +60 35 13 | Flat Field | 2.0 | 1.152217579019225 | r |
| 18 | skyflat-0005r.fit | 2024-03-20T09:50:58 | skyflat | 08 12 35 | +60 35 13 | Flat Field | 2.0 | 1.152217579019225 | r |
| 19 | skyflat-0006r.fit | 2024-03-20T09:51:12 | skyflat | 08 12 49 | +60 35 13 | Flat Field | 2.0 | 1.1522187289365808 | r |
| 20 | skyflat-0007r.fit | 2024-03-20T09:51:26 | skyflat | 08 13 04 | +60 35 14 | Flat Field | 2.0 | 1.1522221787234155 | r |
| 21 | skyflat-0001g.fit | 2024-03-20T09:55:37 | skyflat | 08 17 16 | +60 35 21 | Flat Field | 2.0 | 1.1522187289365808 | g |
| 22 | skyflat-0002g.fit | 2024-03-20T09:55:51 | skyflat | 08 17 30 | +60 35 22 | Flat Field | 2.0 | 1.1522152792018971 | g |
| 23 | skyflat-0003g.fit | 2024-03-20T09:56:05 | skyflat | 08 17 44 | +60 35 22 | Flat Field | 2.0 | 1.1522187289365808 | g |
| 24 | skyflat-0004g.fit | 2024-03-20T09:56:19 | skyflat | 08 17 58 | +60 35 22 | Flat Field | 2.0 | 1.152217579019225 | g |
| 25 | skyflat-0005g.fit | 2024-03-20T09:56:33 | skyflat | 08 18 13 | +60 35 23 | Flat Field | 2.0 | 1.1522187289365808 | g |
| 26 | skyflat-0006g.fit | 2024-03-20T09:56:47 | skyflat | 08 18 26 | +60 35 23 | Flat Field | 2.0 | 1.152219878859731 | g |
| 27 | skyflat-0007g.fit | 2024-03-20T09:57:01 | skyflat | 08 18 40 | +60 35 24 | Flat Field | 2.0 | 1.1522164291076638 | g |
| 28 | M101-0001g.fit | 2024-03-20T13:46:31 | M101 | 14 03 15 | +54 20 40 | Light Frame | 180.0 | 1.3471224286680594 | g |
| 29 | M101-0002g.fit | 2024-03-20T13:49:43 | M101 | 14 03 15 | +54 20 40 | Light Frame | 180.0 | 1.3372890993380804 | g |
| 30 | M101-0003g.fit | 2024-03-20T13:52:55 | M101 | 14 03 15 | +54 20 40 | Light Frame | 180.0 | 1.3277368037391455 | g |
| 31 | M101-0001r.fit | 2024-03-20T13:56:06 | M101 | 14 03 15 | +54 20 40 | Light Frame | 180.0 | 1.3183926677509952 | r |
| 32 | M101-0002r.fit | 2024-03-20T13:59:18 | M101 | 14 03 15 | +54 20 40 | Light Frame | 180.0 | 1.3092440875166884 | r |
| 33 | M101-0003r.fit | 2024-03-20T14:02:29 | M101 | 14 03 15 | +54 20 40 | Light Frame | 180.0 | 1.300365998812042 | r |
| 34 | M101-0001i.fit | 2024-03-20T14:05:41 | M101 | 14 03 15 | +54 20 40 | Light Frame | 180.0 | 1.291625580691236 | i |
| 35 | M101-0002i.fit | 2024-03-20T14:08:52 | M101 | 14 03 15 | +54 20 40 | Light Frame | 180.0 | 1.2831247255886573 | i |
| 36 | M101-0003i.fit | 2024-03-20T14:12:04 | M101 | 14 03 15 | +54 20 40 | Light Frame | 180.0 | 1.2748610177362498 | i |
| 37 | M101-0001Ha.fit | 2024-03-20T14:15:18 | M101 | 14 03 15 | +54 20 40 | Light Frame | 180.0 | 1.2666825141876346 | Ha |
| 38 | M101-0002Ha.fit | 2024-03-20T14:18:29 | M101 | 14 03 15 | +54 20 40 | Light Frame | 180.0 | 1.2587544068516756 | Ha |
| 39 | M101-0003Ha.fit | 2024-03-20T14:21:41 | M101 | 14 03 15 | +54 20 40 | Light Frame | 180.0 | 1.2510514616626078 | Ha |
| 40 | Calibration-0001bias.fit | 2024-03-20T15:50:31 | Calibration | 14 14 26 | +60 37 30 | Bias Frame | 0.0 | 1.1522302284288428 | unknown |
| 41 | Calibration-0002bias.fit | 2024-03-20T15:50:39 | Calibration | 14 14 27 | +60 37 30 | Bias Frame | 0.0 | 1.1520991685626514 | unknown |
| 42 | Calibration-0003bias.fit | 2024-03-20T15:50:46 | Calibration | 14 14 35 | +60 37 30 | Bias Frame | 0.0 | 1.1521129607926952 | unknown |
| 43 | Calibration-0004bias.fit | 2024-03-20T15:50:53 | Calibration | 14 14 42 | +60 37 29 | Bias Frame | 0.0 | 1.1521083632900055 | unknown |
| 44 | Calibration-0005bias.fit | 2024-03-20T15:51:01 | Calibration | 14 14 49 | +60 37 29 | Bias Frame | 0.0 | 1.1521072139288138 | unknown |
| 45 | Calibration-0001dk2.fit | 2024-03-20T15:51:08 | Calibration | 12 12 25 | +07 34 55 | Dark Frame | 2.0 | 1.15419822429397 | unknown |
| 46 | Calibration-0002dk2.fit | 2024-03-20T15:51:17 | Calibration | 23 58 46 | -00 08 05 | Dark Frame | 2.0 | -1.0 | unknown |
| 47 | Calibration-0003dk2.fit | 2024-03-20T15:51:26 | Calibration | 23 58 46 | -00 08 05 | Dark Frame | 2.0 | -1.0 | unknown |
| 48 | Calibration-0004dk2.fit | 2024-03-20T15:51:35 | Calibration | 23 58 46 | -00 08 05 | Dark Frame | 2.0 | -1.0 | unknown |
| 49 | Calibration-0005dk2.fit | 2024-03-20T15:51:43 | Calibration | 23 58 46 | -00 08 05 | Dark Frame | 2.0 | -1.0 | unknown |
| 50 | Calibration-0001dk3.fit | 2024-03-20T15:51:52 | Calibration | 23 58 46 | -00 08 05 | Dark Frame | 3.0 | -1.0 | unknown |
| 51 | Calibration-0002dk3.fit | 2024-03-20T15:52:01 | Calibration | 23 58 46 | -00 08 05 | Dark Frame | 3.0 | -1.0 | unknown |
| 52 | Calibration-0003dk3.fit | 2024-03-20T15:52:10 | Calibration | 23 58 46 | -00 08 05 | Dark Frame | 3.0 | -1.0 | unknown |
| 53 | Calibration-0004dk3.fit | 2024-03-20T15:52:19 | Calibration | 23 58 46 | -00 08 05 | Dark Frame | 3.0 | -1.0 | unknown |
| 54 | Calibration-0005dk3.fit | 2024-03-20T15:52:28 | Calibration | 23 58 46 | -00 08 05 | Dark Frame | 3.0 | -1.0 | unknown |
| 55 | Calibration-0001dk180.fit | 2024-03-20T16:13:09 | Calibration | 23 58 46 | -00 08 05 | Dark Frame | 180.0 | -1.0 | unknown |
| 56 | Calibration-0002dk180.fit | 2024-03-20T16:16:15 | Calibration | 23 58 46 | -00 08 05 | Dark Frame | 180.0 | -1.0 | unknown |
| 57 | Calibration-0003dk180.fit | 2024-03-20T16:19:21 | Calibration | 23 58 46 | -00 08 05 | Dark Frame | 180.0 | -1.0 | unknown |
| 58 | Calibration-0004dk180.fit | 2024-03-20T16:22:27 | Calibration | 23 58 46 | -00 08 05 | Dark Frame | 180.0 | -1.0 | unknown |
| 59 | Calibration-0005dk180.fit | 2024-03-20T16:25:33 | Calibration | 23 58 46 | -00 08 05 | Dark Frame | 180.0 | -1.0 | unknown |
# table for each type of frame
bias_table = summary_table[summary_table['imagetyp'] == 'Bias Frame']
dark_table = summary_table[summary_table['imagetyp'] == 'Dark Frame']
flat_table = summary_table[summary_table['imagetyp'] == 'Flat Field']
sci_table = summary_table[summary_table['imagetyp'] == 'Light Frame']

# counting the number of frames
print(f'Number of bias frames: {len(bias_table)}')
print(f'Number of dark frames: {len(dark_table)}')
print(f'Number of flat frames: {len(flat_table)}')
print(f'Number of flat frames with g-band: {len(flat_table[flat_table["filter"] == "g"])}')
print(f'Number of science frames: {len(sci_table)}')
print(f'Number of science frames with g-band: {len(sci_table[sci_table["filter"] == "g"])}')
Number of bias frames: 5
Number of dark frames: 15
Number of flat frames: 28
Number of flat frames with g-band: 7
Number of science frames: 12
Number of science frames with g-band: 3
# test reading of science frame
fname = RAWDIR / sci_table['filename'][0]
hdu = fits.open(fname)
isci = 0
sci = hdu[isci].data # 2D image array of pixel counts
hdr = hdu[isci].header # image header information
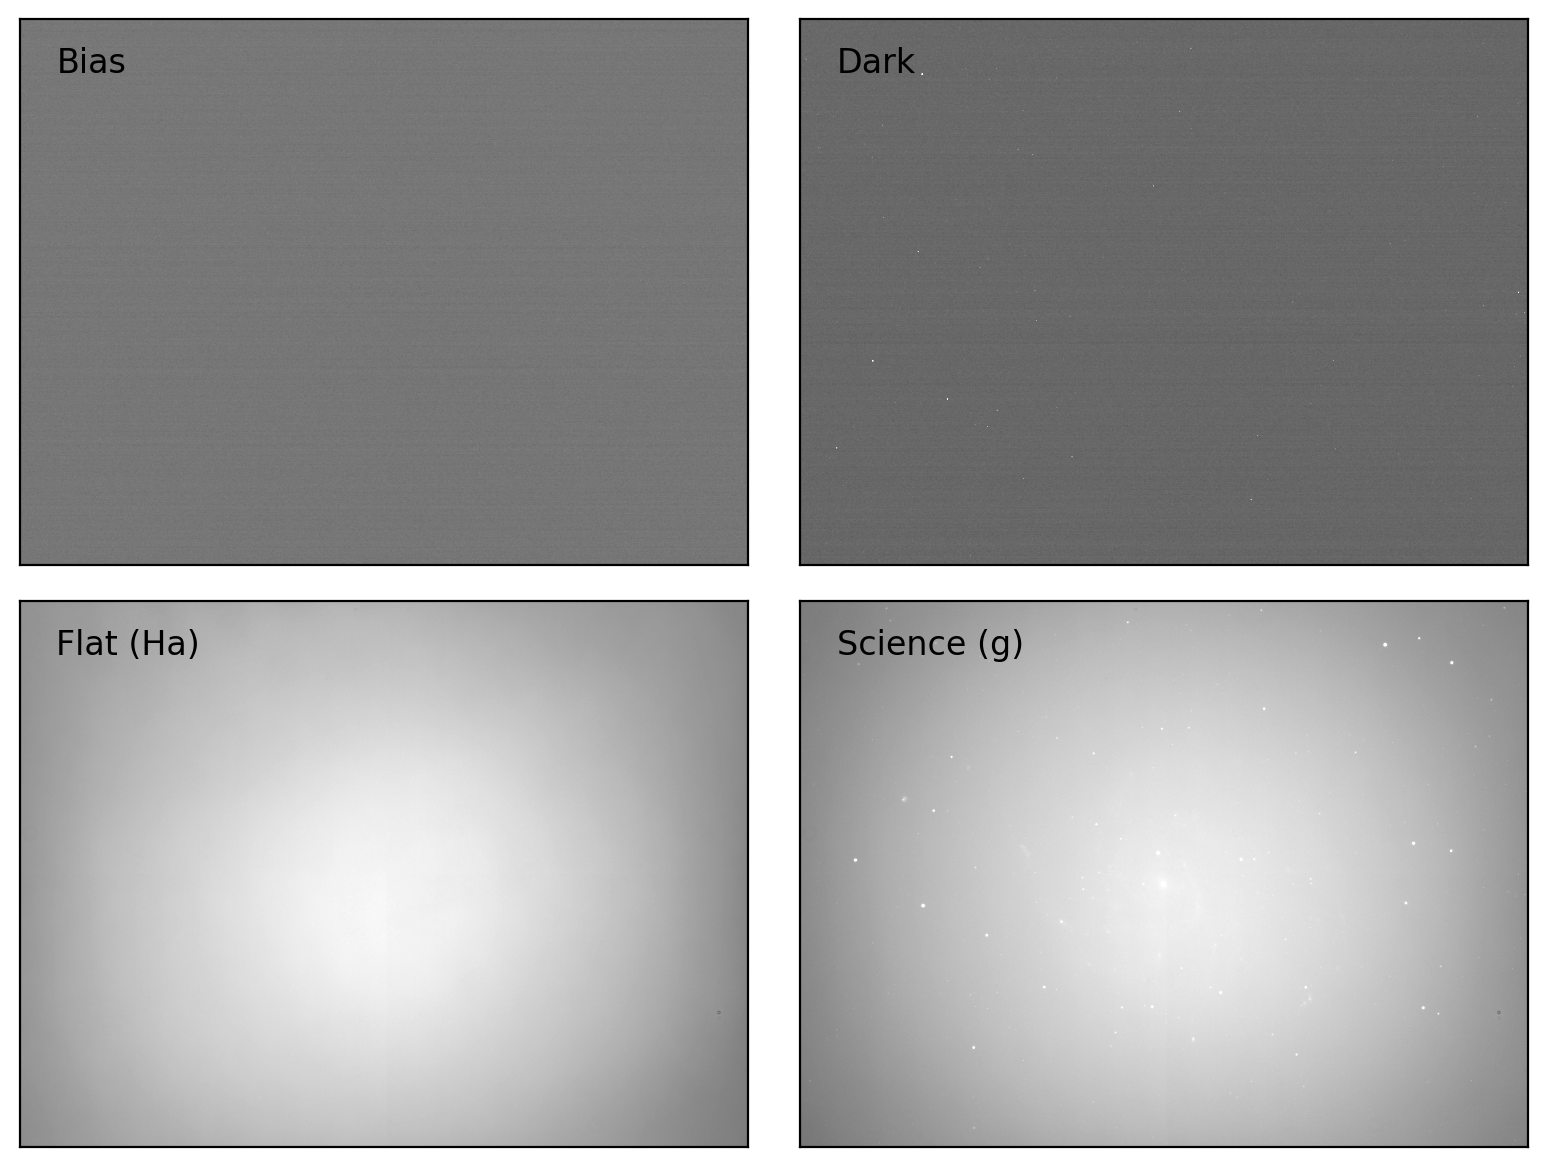
# simple visulization of the image
ibias, idark, iflat = 0, 0, 4
bias = fits.getdata(RAWDIR / bias_table['filename'][ibias])
dark = fits.getdata(RAWDIR / dark_table['filename'][idark])
flat = fits.getdata(RAWDIR / flat_table['filename'][iflat])
# for displaying in zscale
interval = ZScaleInterval()

# plotting the images
fig, axes = plt.subplots(2, 2, figsize=(8, 6))
titles = ['Bias', 'Dark', f'Flat ({flat_table['filter'][iflat]})',
          f'Science ({sci_table['filter'][isci]})']
for i, img in enumerate([bias, dark, flat, sci]):
    vmin, vmax = interval.get_limits(img)
    ax = axes[i // 2][i % 2]
    ax.imshow(img, cmap='gray', origin='lower', vmin=vmin, vmax=vmax)
    ax.text(0.05, 0.95, titles[i], transform=ax.transAxes, ha='left', va='top')
    ax.tick_params(axis='both', length=0.0, labelleft=False, labelbottom=False)
plt.tight_layout()
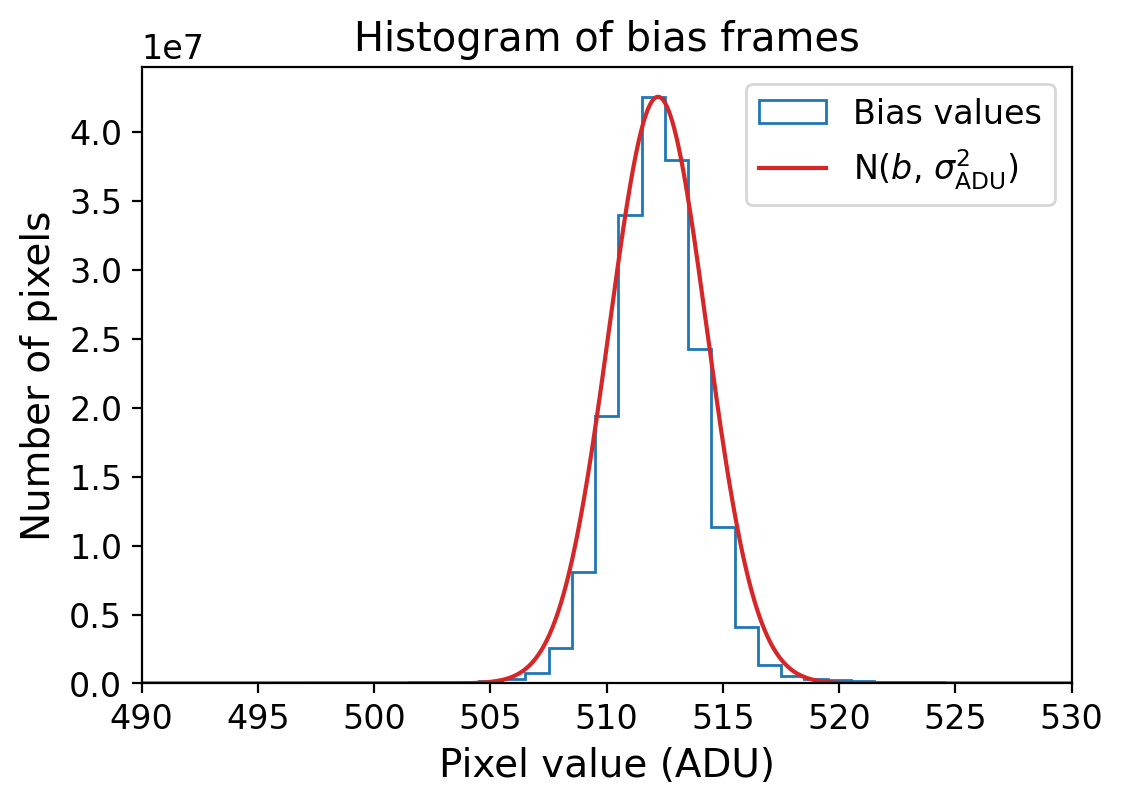
\[\sigma_{\rm ADU} = \frac{\rm Readout\ noise}{\rm Gain}\]
# get readout noise from bias frames
bias_imgs = np.array([fits.getdata(RAWDIR/f) for f in bias_table['filename']])

# bring gain
gain = fits.getheader(RAWDIR / bias_table['filename'][0])['EGAIN'] # e-/ADU

# calculate the readout noise
bias_level = np.mean(bias_imgs.ravel())
sig_adu = np.std(bias_imgs, ddof=1) # ADU
rdnoise = sig_adu * gain # e-

# plot the bias histogram
fig = plt.figure(figsize=(6, 4))
ax = fig.add_subplot(111)
bins = np.arange(490, 530, 1)
y, _, _ = ax.hist(np.ravel(bias_imgs), bins=bins, histtype='step', align='left',
               label='Bias values')
# Gaussian model for comparison
x = np.linspace(490, 530, 1000)
gaussian = np.exp(-0.5 * ((x - bias_level) / sig_adu)**2) * np.max(y)
ax.plot(x, gaussian, c='tab:red', label=r'N($b$, $\sigma_{\rm ADU}^2$)')
ax.set_xlabel('Pixel value (ADU)')
ax.set_ylabel('Number of pixels')
ax.set_xlim(490, 530)
ax.set_title('Histogram of bias frames')
ax.legend()
<matplotlib.legend.Legend at 0x174bbadb0>
CCD Data Reduction Guide - 1.5. Image combination
# create a master bias combining all bias frames
# median combine the bias frames
start = time.time()
medi_combine = np.median(bias_imgs, axis=0)
finish = time.time()
print(f'Time taken by median combine: {finish - start:.2f} s')

# combining bias frames with sigma clipping
# - stacking the empty array with bias frames (using CCDData)
bias_stack = []
for i in range(len(bias_table)):
    bias_data, bias_hdr = fits.getdata(RAWDIR/bias_table['filename'][i], header=True)
    bias = CCDData(data=bias_data, header=bias_hdr, unit='adu')
    bias_stack.append(bias)
# - combining
start = time.time()
clip_combine = combine(bias_stack, sigma_clip=True,
                       sigma_clip_high_thresh=3, sigma_clip_low_thresh=3)
finish = time.time()
print(f'Time taken by sigma clipping combine: {finish - start:.2f} s')

fig, axes = plt.subplots(1, 3, figsize=(13, 7))
vmin, vmax = interval.get_limits(medi_combine)
axes[0].imshow(bias_imgs[0], cmap='gray', origin='lower', vmin=vmin, vmax=vmax)
axes[1].imshow(medi_combine, cmap='gray', origin='lower', vmin=vmin, vmax=vmax)
axes[2].imshow(clip_combine, cmap='gray', origin='lower', vmin=vmin, vmax=vmax)
axes[0].text(0.50, 0.96, 'Single bias frame',
             fontsize=12.0, bbox=dict(facecolor='white', alpha=0.5),
             transform=axes[0].transAxes, ha='center', va='top')
axes[1].text(0.50, 0.96, 'Median',
             fontsize=12.0, bbox=dict(facecolor='white', alpha=0.5),
             transform=axes[1].transAxes, ha='center', va='top')
axes[2].text(0.50, 0.96, 'Clipped average',
             fontsize=12.0, bbox=dict(facecolor='white', alpha=0.5),
             transform=axes[2].transAxes, ha='center', va='top')
axes[0].text(0.04, 0.15,
             f"Mean bias level: {np.mean(bias_imgs[0]):.1f} (count)"+
             f"\nRMS error: {np.std(bias_imgs[0]):.3f} (count)",
             fontsize=10.0, bbox=dict(facecolor='white', alpha=0.5),
             transform=axes[0].transAxes, ha='left', va='top')
axes[1].text(0.04, 0.15,
             f"Mean bias level: {np.mean(medi_combine):.1f} (count)"+
             f"\nRMS error: {np.std(bias_imgs[0]):.3f} (count)",
             fontsize=10.0, bbox=dict(facecolor='white', alpha=0.5),
             transform=axes[1].transAxes, ha='left', va='top')
axes[2].text(0.04, 0.15,
             f"Mean bias level: {np.mean(clip_combine.data):.1f} (count)"+
             f"\nRMS error: {np.std(bias_imgs[0]):.3f} (count)",
             fontsize=10.0, bbox=dict(facecolor='white', alpha=0.5),
             transform=axes[2].transAxes, ha='left', va='top')
for ax in axes:
    ax.tick_params(axis='both', length=0.0, labelleft=False, labelbottom=False)
plt.tight_layout()

# bias histogram
fig = plt.figure(figsize=(6, 4))
ax = fig.add_subplot(111)
bins = np.arange(490, 530, 1)
_ = ax.hist(np.ravel(bias_imgs[0]), bins=bins, histtype='step',
                     label='Single bias frame', color='tab:blue')
_ = ax.hist(np.ravel(medi_combine), bins=bins, histtype='step',
            label='Median', color='tab:red')
_ = ax.hist(np.ravel(clip_combine), bins=bins, histtype='step',
            label='Clipped average', color='tab:green')
ax.set_xlim(490, 530)
ax.set_xlabel('Pixel value (ADU)')
ax.set_ylabel('Number of pixels')
ax.set_title('Histogram of bias frames')
ax.legend()

# write the master bias to a fits file
mbias_file = OUTDIR / 'Mbias.fits'
bias_hdr = fits.getheader(RAWDIR / bias_table['filename'][0])
bias_hdr['RDNOISE'] = rdnoise # record the readout noise
bias_hdr['HISTORY'] = 'Master bias frame'
bias_hdr['HISTORY'] = f'Created on {time.asctime()}'
fits.writeto(mbias_file, clip_combine.data, bias_hdr, overwrite=True)

del bias_imgs, bias_stack, medi_combine, clip_combine
Time taken by median combine: 1.17 s
Time taken by sigma clipping combine: 8.33 s
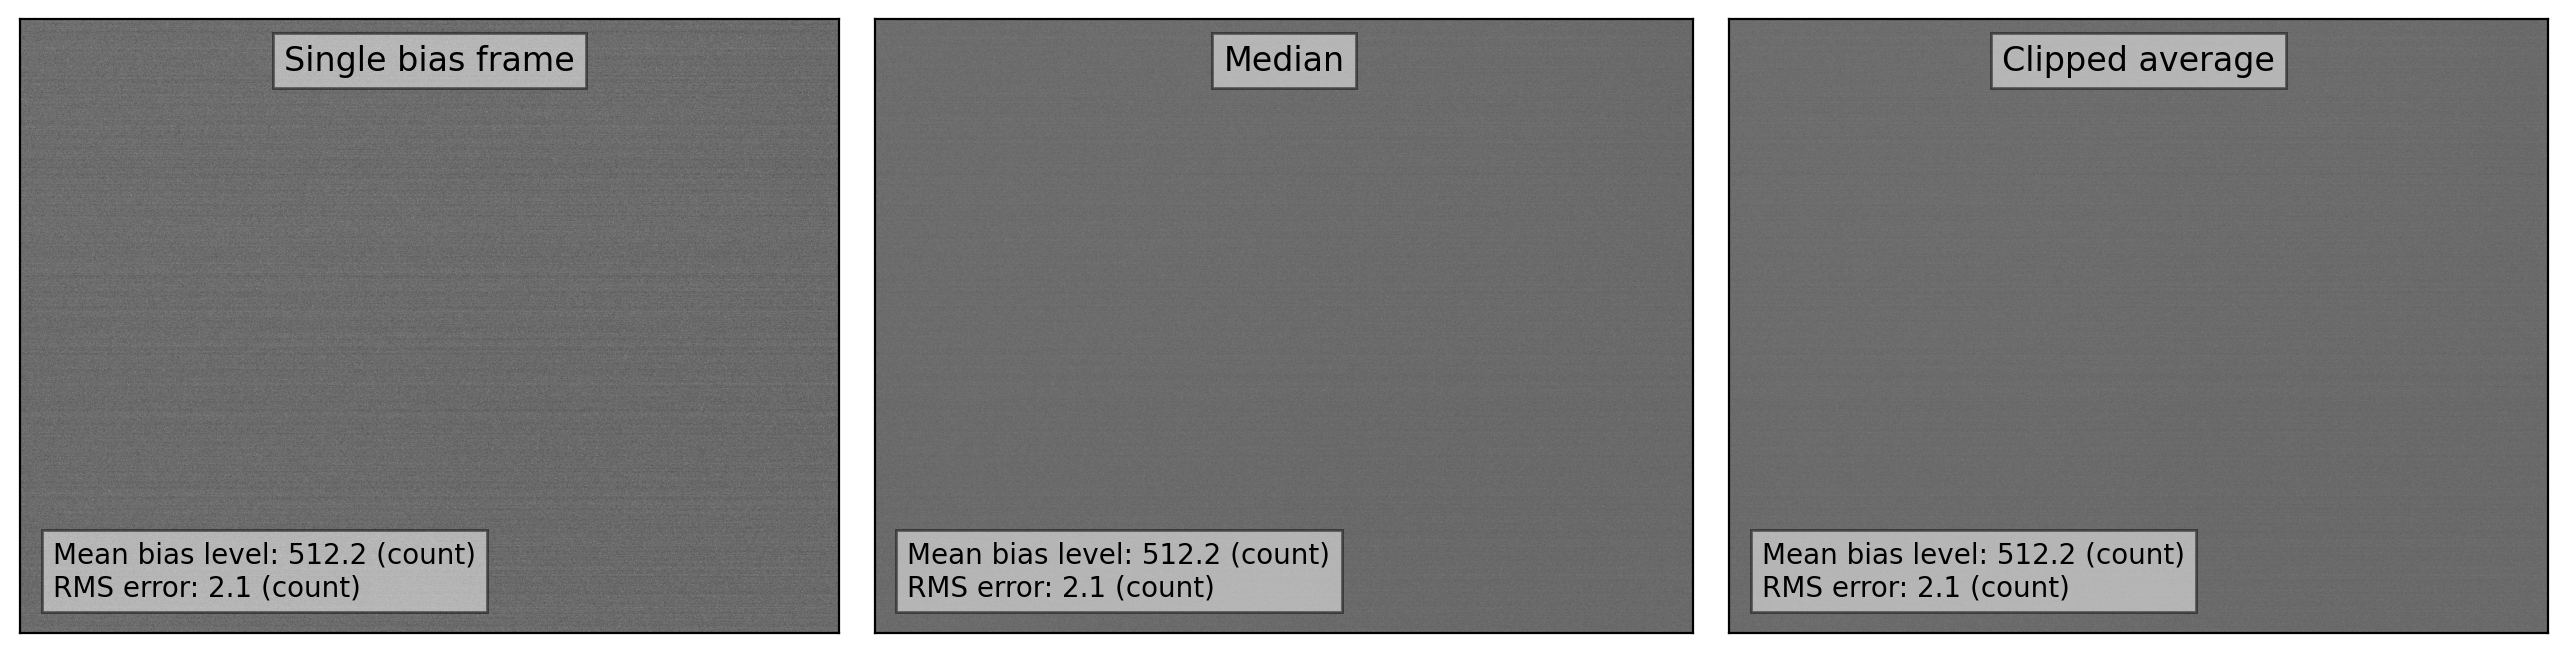
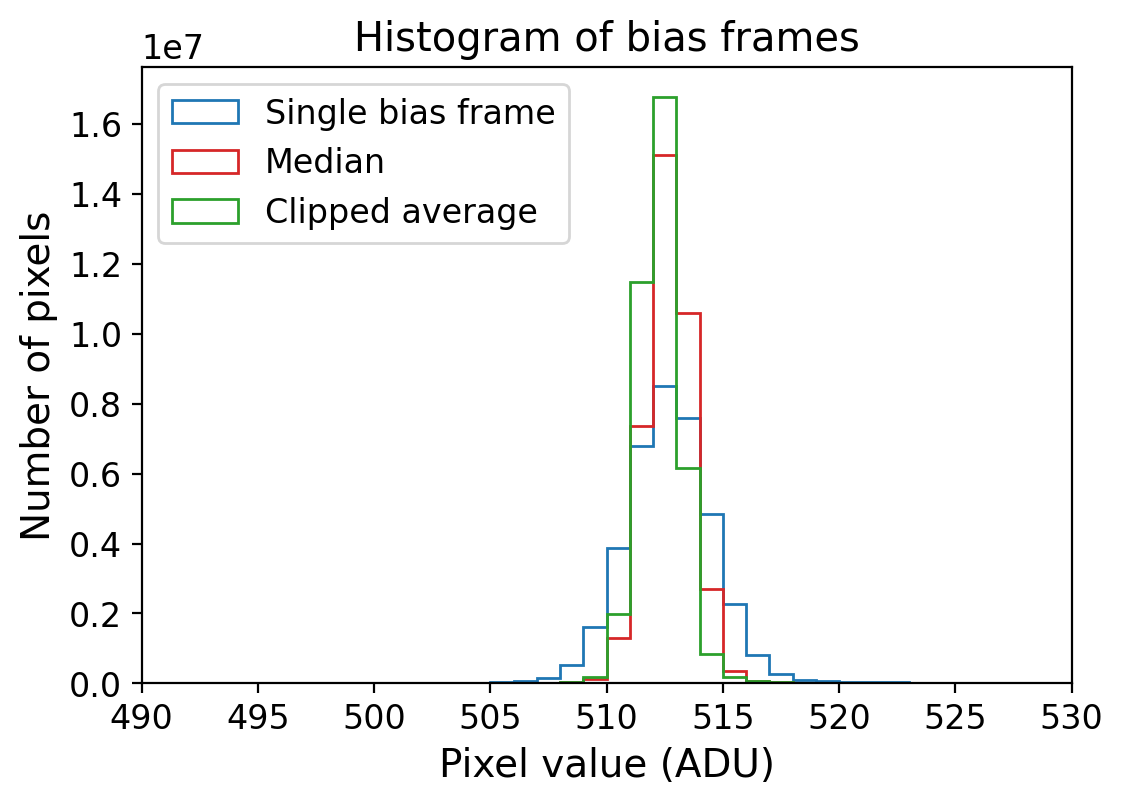
The level of the noises is slightly reduced by combining the images. In this case, we only combined five bias frames. However, for more serious data reduction, combining typically more than 10 bias frames is recommended to reduce the noise of the bias level further.
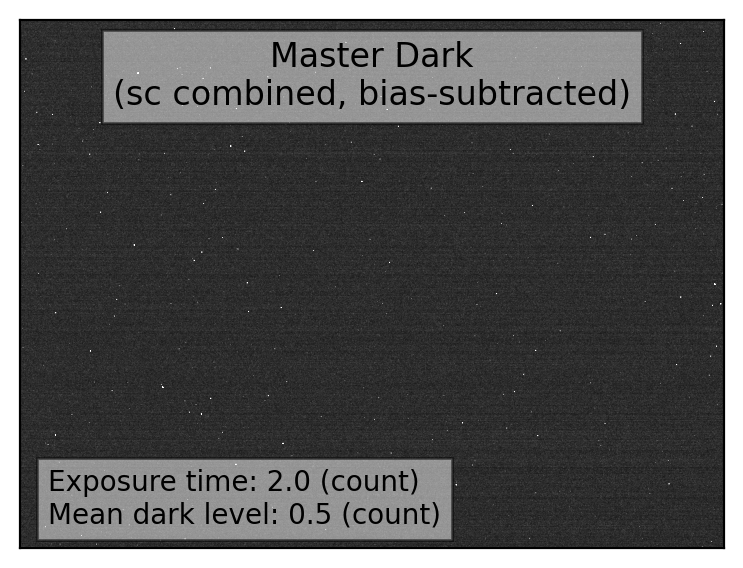
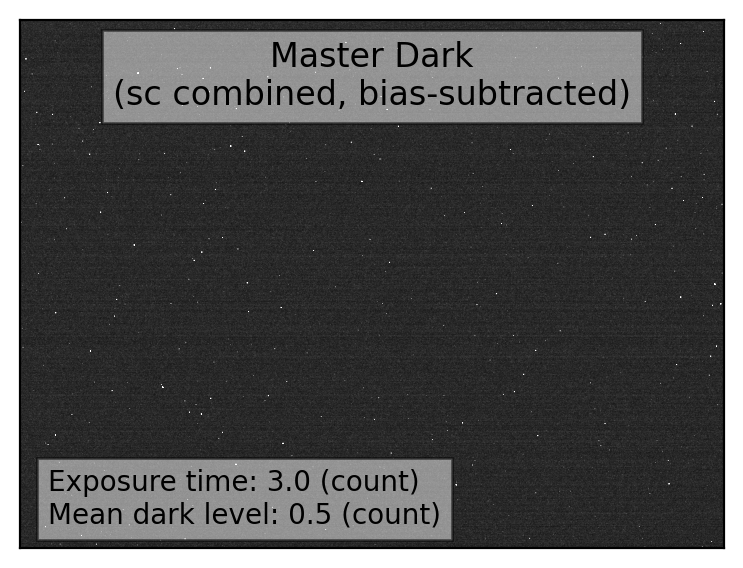
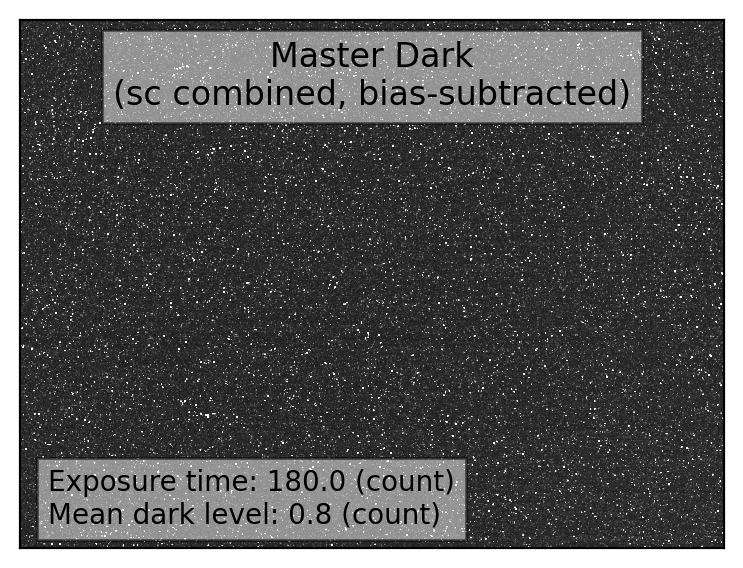
# - Note that the dark frames might have different exposure times.
def make_mdark(dark_list, mbias=None, verbose=True, plot=False):
    # - checking the basic info
    # - Please check the consistancy in observation dates and exposure times.
    if verbose:
        for i in np.arange(len(dark_list)):
                dark_hdr = fits.getheader(dark_list[i])
                print(f"\nDark frame {i+1:d}")
                for keys in ['DATE-OBS', 'EXPTIME']:
                        print("  "+keys+" = "+str(dark_hdr[keys]))

    if mbias is None:
        mbias_data = 0.
    else:
        mbias_data = fits.getdata(mbias)

    # - stacking dark frames
    dark_stack = []
    start = time.time()
    for i in range(len(dark_list)):
        dark_data, dark_hdr = fits.getdata(dark_list[i], header=True)
        dark_bn = (dark_data - mbias_data)# / dark_hdr['EXPTIME']
        dark = CCDData(data=dark_bn, header=dark_hdr, unit='adu')
        dark_stack.append(dark)
    finish = time.time()
    print(f"\nReading {len(dark_list)} dark frames took {finish-start:.2f} sec")

    # - combine with sigma clipping
    start = time.time()
    mdark = combine(dark_stack, sigma_clip=True,
                    sigma_clip_high_thresh=3, sigma_clip_low_thresh=3)
    finish = time.time()
    print(f"Combining {len(dark_list)} dark frames took {finish-start:.2f} sec")

    # - correcting the negative values
    mdark.data[mdark.data < 0.] = 0.

    # - save the master dark as fits file
    start = time.time()
    dark_hdr['NFRAMES'] = len(dark_list)  # recording # of dark frames combined
    fits.writeto(OUTDIR/f"MDark{dark_hdr['EXPTIME']:.0f}.fits",
                 mdark, dark_hdr, overwrite=True)
    finish = time.time()
    print(f"Writing the master dark took {finish-start:.2f} sec")

    if plot:
        # - visualization of the master dark
        fig, ax = plt.subplots(1, 1, figsize=(5,3))
        vmin, vmax = interval.get_limits(mdark)
        ax.imshow(mdark, origin='lower', vmin=vmin, vmax=vmax, cmap='gray')
        ax.tick_params(axis='both', length=0.0, labelleft=False, labelbottom=False)
        ax.text(0.50, 0.96, "Master Dark\n(sc combined, bias-subtracted)",
                fontsize=12.0, bbox=dict(facecolor='white', alpha=0.5),
                transform=ax.transAxes, ha='center', va='top')
        ax.text(0.04, 0.15, f"Exposure time: {dark_hdr['EXPTIME']:.1f} (count)"+
                f"\nMean dark level: {np.mean(mdark.data):.1f} (count)",
                fontsize=10.0, bbox=dict(facecolor='white', alpha=0.5),
                transform=ax.transAxes, ha='left', va='top')
        plt.tight_layout()

    return mdark
# create master darks for each exposure time
mbias_file = OUTDIR / 'Mbias.fits'
for group in dark_table.group_by('exptime').groups: # group by exposure time
    fnames = [RAWDIR/f for f in group['filename']]
    _ = make_mdark(fnames, mbias_file, verbose=False, plot=True)
Reading 5 dark frames took 1.61 sec
Combining 5 dark frames took 10.46 sec
Writing the master dark took 0.15 sec

Reading 5 dark frames took 0.98 sec
Combining 5 dark frames took 8.49 sec
Writing the master dark took 0.15 sec

Reading 5 dark frames took 1.01 sec
Combining 5 dark frames took 9.59 sec
Writing the master dark took 0.13 sec
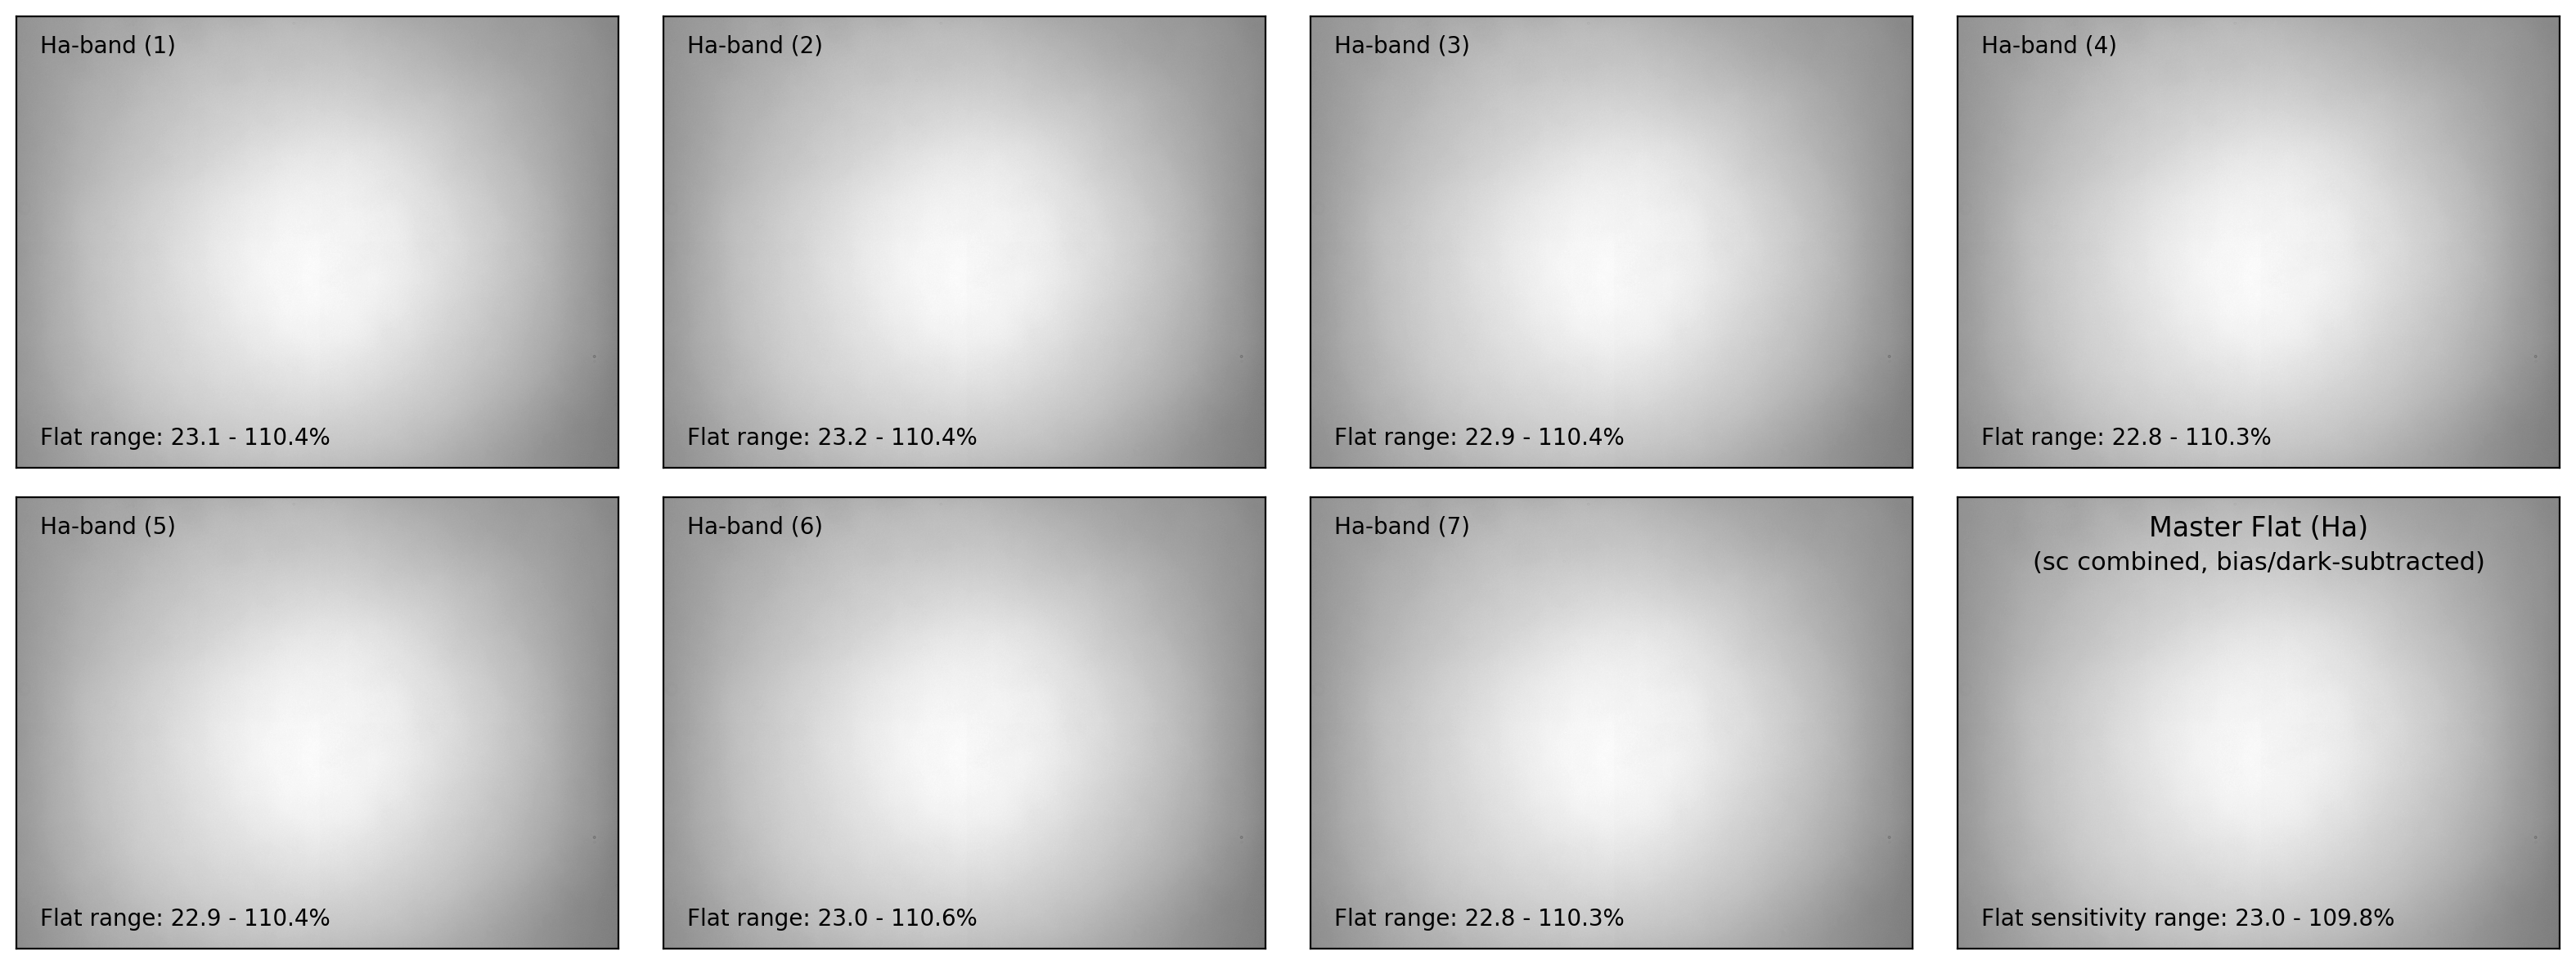
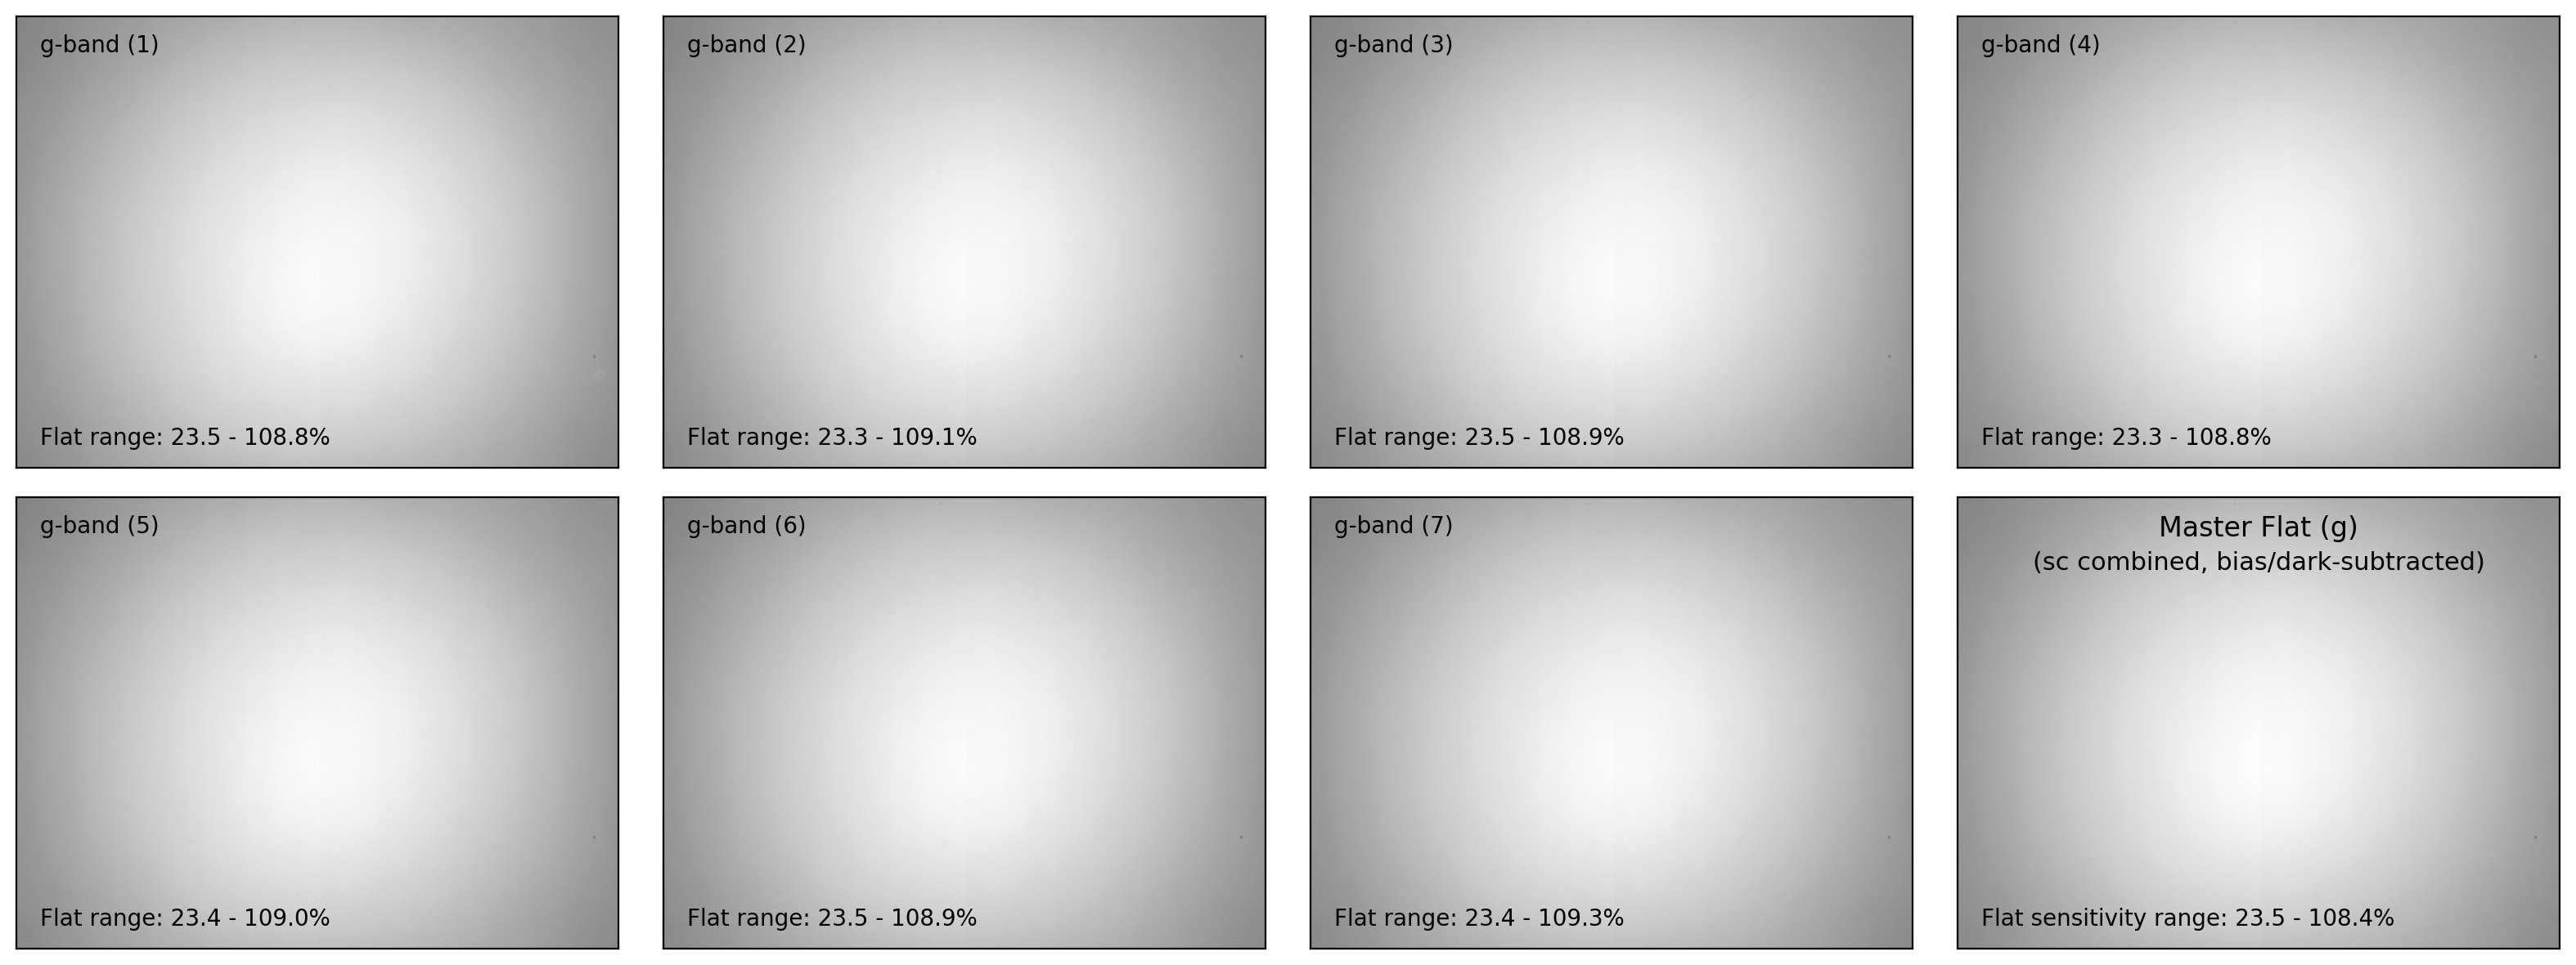
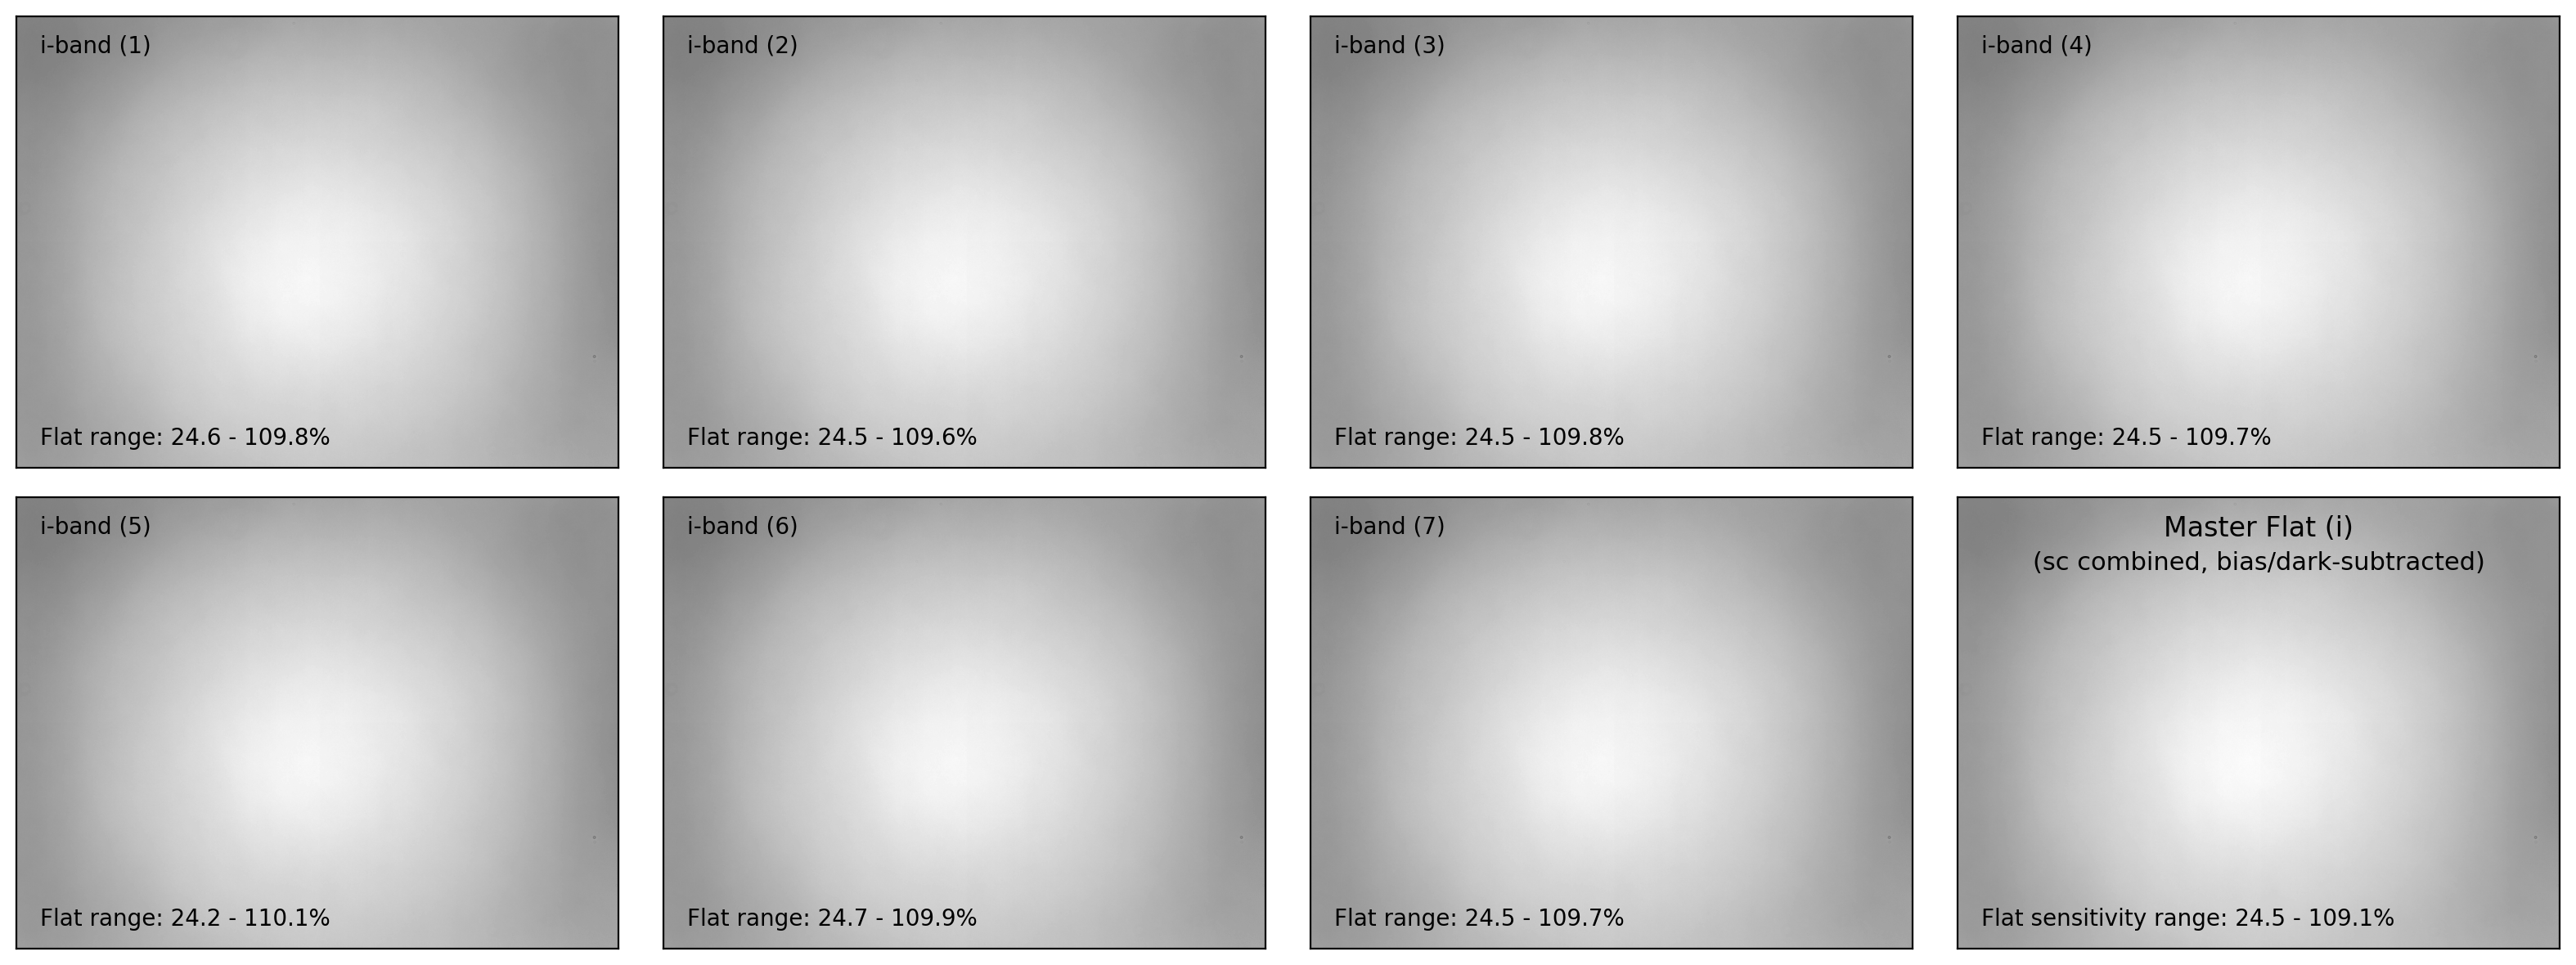
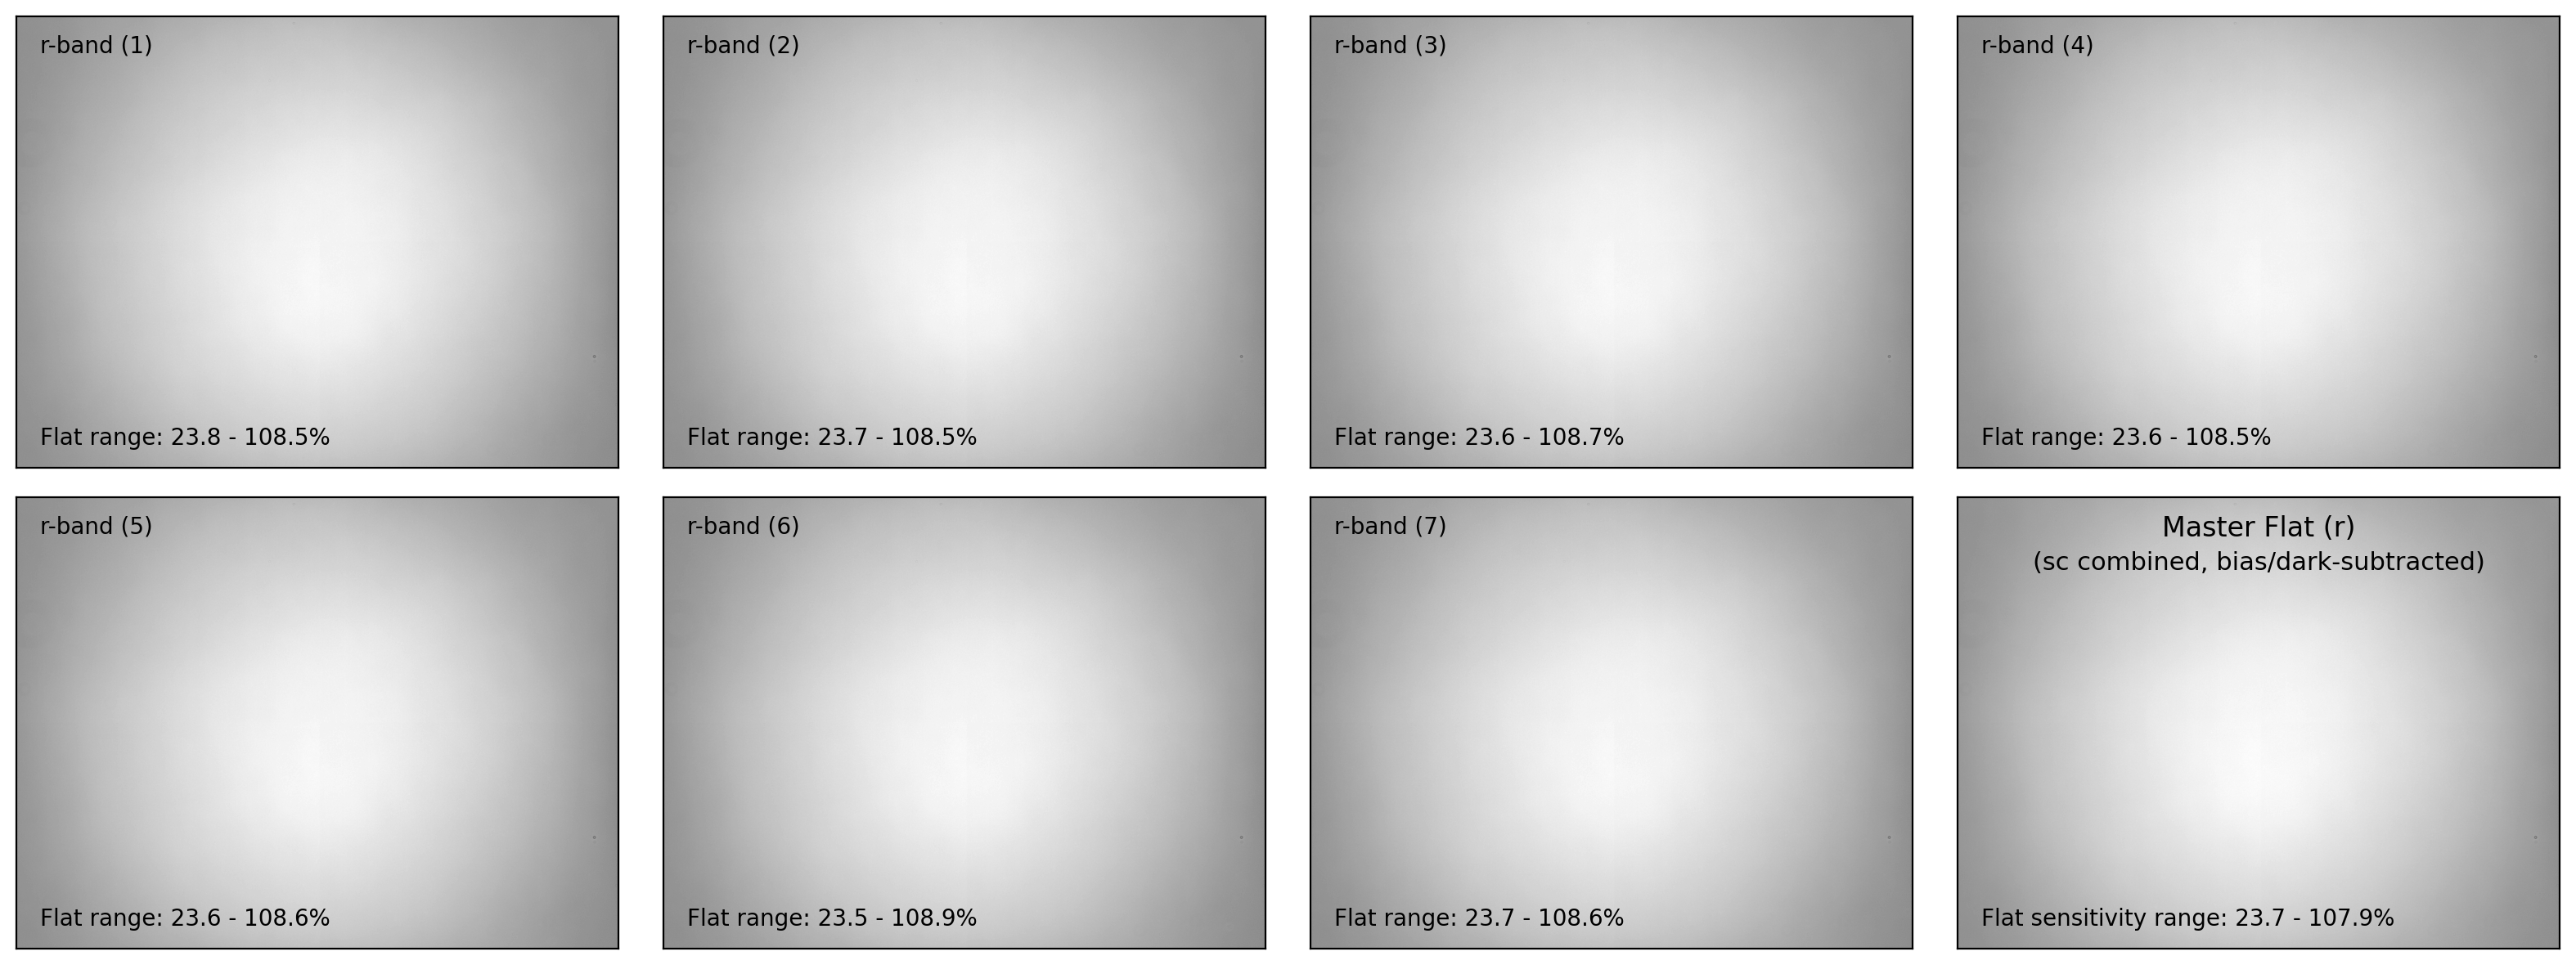
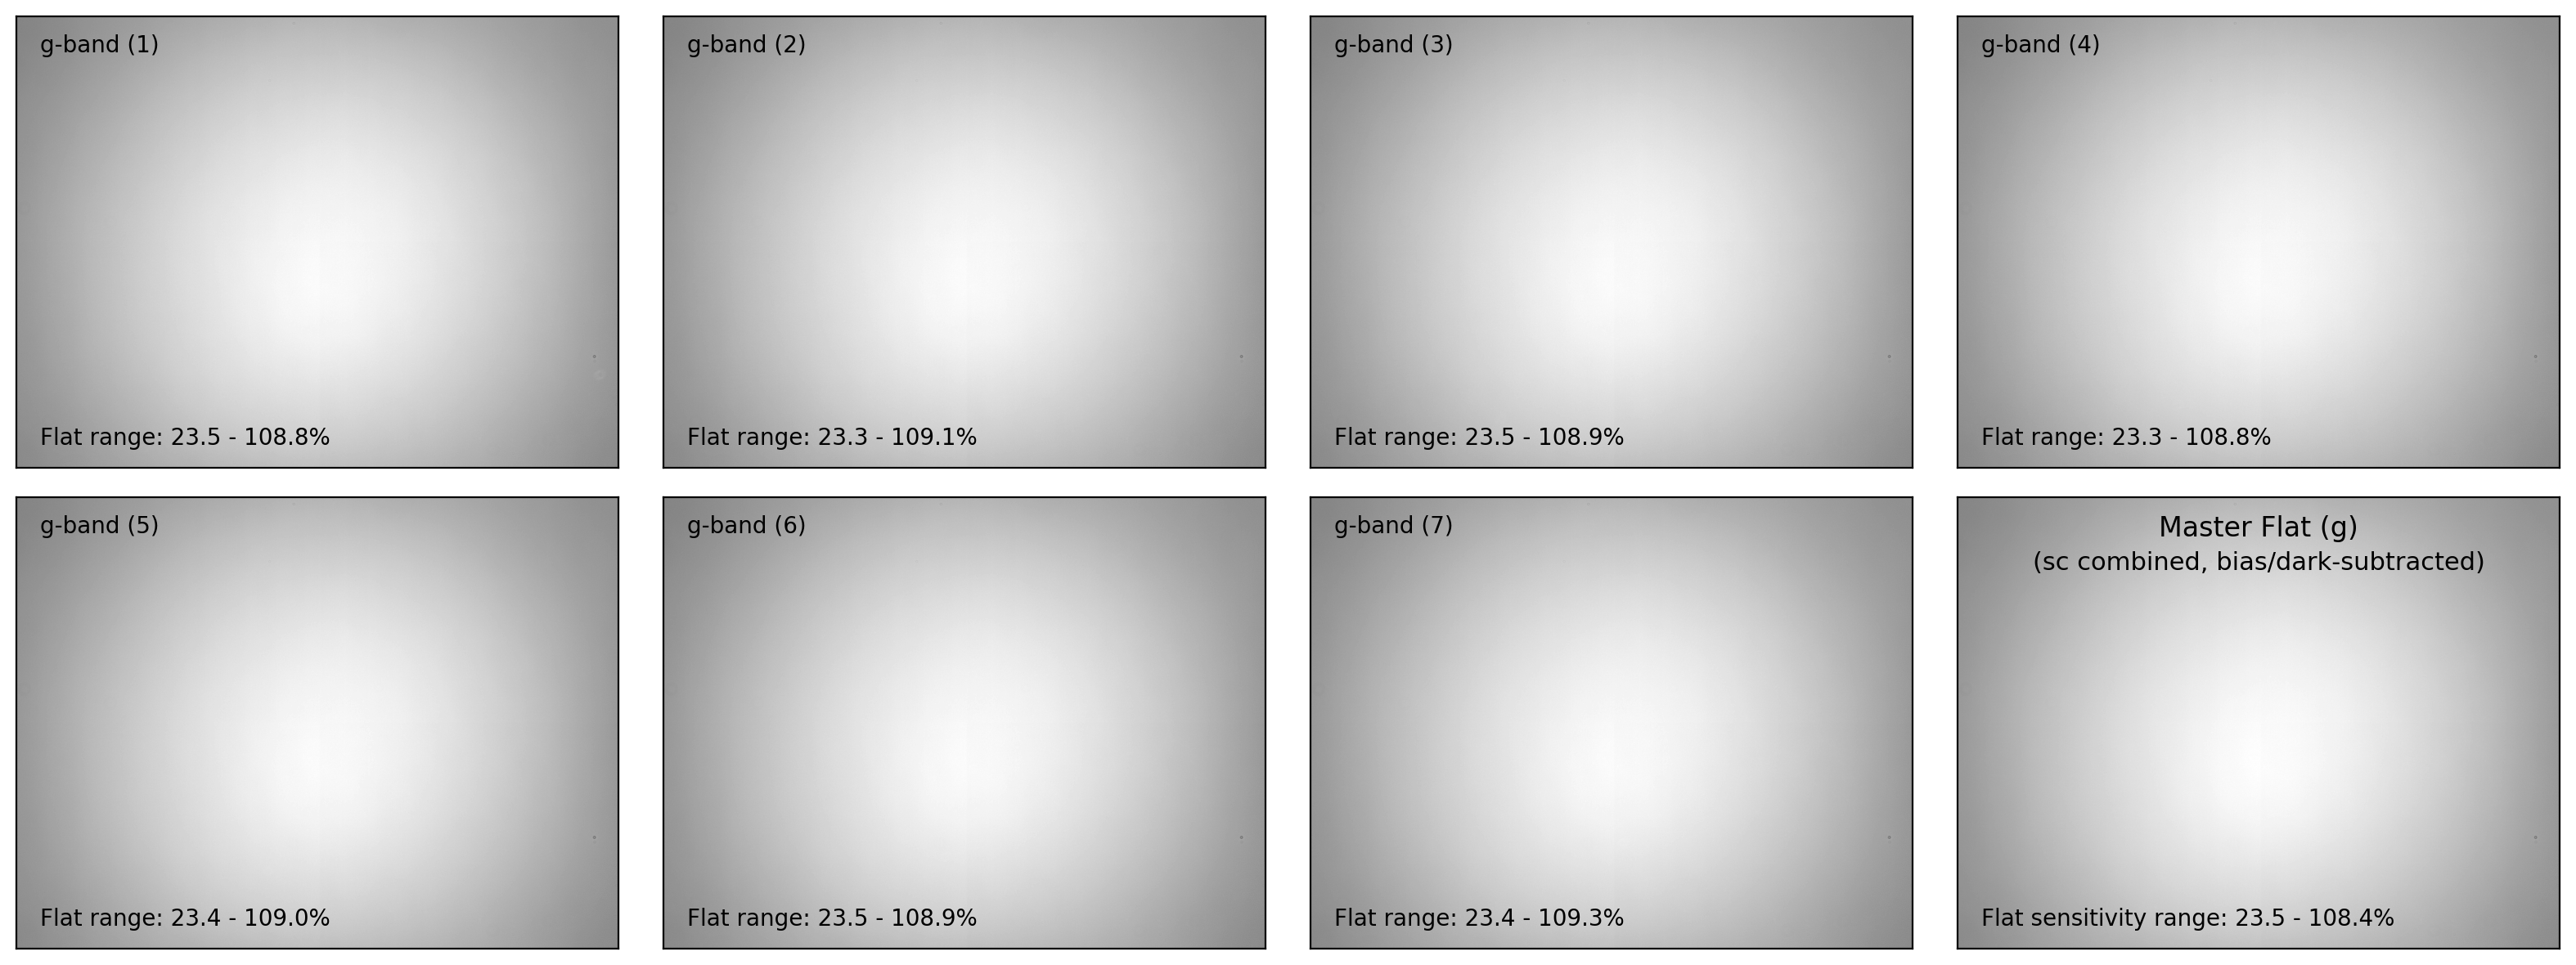
# - combining flat frames for each filter
def make_mflat(flat_list, mbias=None, mdark=None, verbose=True, plot=False):
    if verbose:
        # - checking the basic info : check dates, exposure times, and filters.
        for i in np.arange(len(flat_list)):
            flat_hdr = fits.getheader(flat_list[i])
            print(f"\nFlat frame {i+1:d}")
            for keys in ['DATE-OBS', 'EXPTIME', 'FILTER']:
                print("  "+keys+" = "+str(flat_hdr[keys]))

    if mbias is None:
        mbias_data = 0.
    else:
        mbias_data = fits.getdata(mbias)

    if mdark is None:
        mdark_data = 0.
    else:
        mdark_data = fits.getdata(mdark)

    # - stacking flat frames
    nflat = len(flat_list)
    flat_stack = []

    if plot:
        ncols = 4
        nrows = (nflat+1)//ncols + 1
        fig, axes = plt.subplots(nrows, ncols, figsize=(4*ncols, 3*nrows))
        interval = ZScaleInterval()

    for i in np.arange(len(flat_list)):
        flat_data, flat_hdr = fits.getdata(flat_list[i], header=True)
        filter_now = flat_hdr['FILTER']     # specifying current filter
        # - bias and dark subtraction
        flat_bd = (flat_data - mbias_data - mdark_data)
        # - flat scaling (with relative sensitivity=1 at the maximum)
        flat_bdn = flat_bd/np.median(flat_bd)
        flat_stack.append(CCDData(data=flat_bdn, unit='adu'))
        if plot:
            ax = axes[i//ncols][i%ncols]
            if i == 0:
                vmin, vmax = interval.get_limits(flat_bdn)
            ax.imshow(flat_bdn, origin='lower', cmap='gray',
                      vmin=vmin, vmax=vmax)
            ax.tick_params(axis='both', length=0.0,
                           labelleft=False, labelbottom=False)
            ax.text(0.04, 0.96, f"{filter_now}-band ({i+1:d})", fontsize=10.0,
                    transform=ax.transAxes, ha='left', va='top')
            ax.text(0.04, 0.04,
                    f"Flat range: {100*flat_bdn.min():.1f}"
                    + f" - {100*flat_bdn.max():.1f}%", ha='left', va='bottom',
                    fontsize=10.0, transform=ax.transAxes)

    if plot:
        for j in np.arange(nflat+1, nrows*ncols):
            fig.delaxes(axes.flatten()[j])
        plt.tight_layout()

    # - sigma clipping
    from astropy.stats import mad_std
    mflat = combine(flat_stack, sigma_clip=True,
                    sigma_clip_low_thresh=3, sigma_clip_high_thresh=3,
                    sigma_clip_func=np.ma.median, sigma_clip_dev_func=mad_std)

    # - save the master flat as fits file
    # - Caveat: this assumes that the flat frames are taken with the same
    #           filter, and they have the same exposure time. If not, you may
    #           need to modify the filename.
    flat_hdr['NFRAMES'] = len(flat_list)
    fits.writeto(OUTDIR/f"MFlat{filter_now}.fits", mflat.data,
                 header=flat_hdr, overwrite=True)

    if plot:
        # - visualization of the master flat
        # fig, ax = plt.subplots(1, 1, figsize=(5,3))
        ax = axes[(i+1)//ncols][-1]
        vmin, vmax = interval.get_limits(mflat)
        ax.imshow(mflat, origin='lower', vmin=vmin, vmax=vmax, cmap='gray')
        ax.tick_params(axis='both', length=0.0, labelleft=False, labelbottom=False)
        ax.text(0.50, 0.96, f"Master Flat ({filter_now})", fontsize=12.0,
                transform=ax.transAxes, ha='center', va='top')
        ax.text(0.50, 0.88, "(sc combined, bias/dark-subtracted)",
                fontsize=11.0, transform=ax.transAxes, ha='center', va='top')
        ax.text(0.04, 0.04, f"Flat sensitivity range: {100*mflat.data.min():.1f}"
                + f" - {100*mflat.data.max():.1f}%", ha='left', va='bottom',
                fontsize=10.0, transform=ax.transAxes)
        plt.tight_layout()

    return mflat
# create master flats for each filter
# flat frames for the same filter have the same exposure time
mbias_file = OUTDIR / 'Mbias.fits'
for group in flat_table.group_by('filter').groups: # group by filter
    fnames = [RAWDIR/f for f in group['filename']]
    mdark_file = OUTDIR/f"MDark{group['exptime'][0]:.0f}.fits"
    _ = make_mflat(fnames, mbias_file, mdark_file, verbose=False, plot=True)
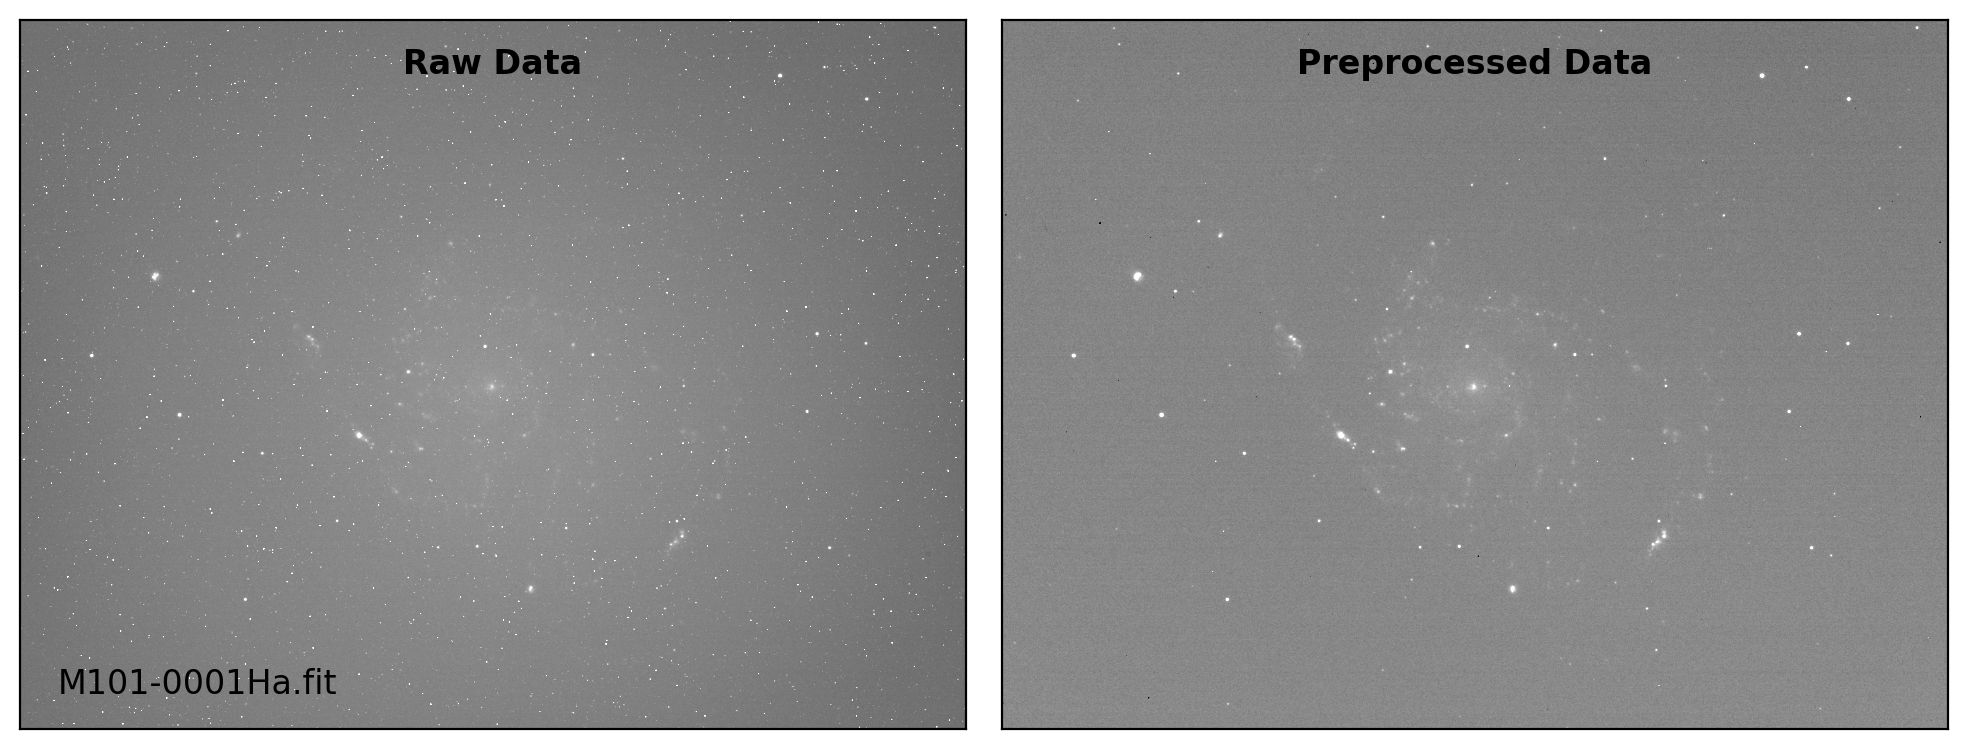
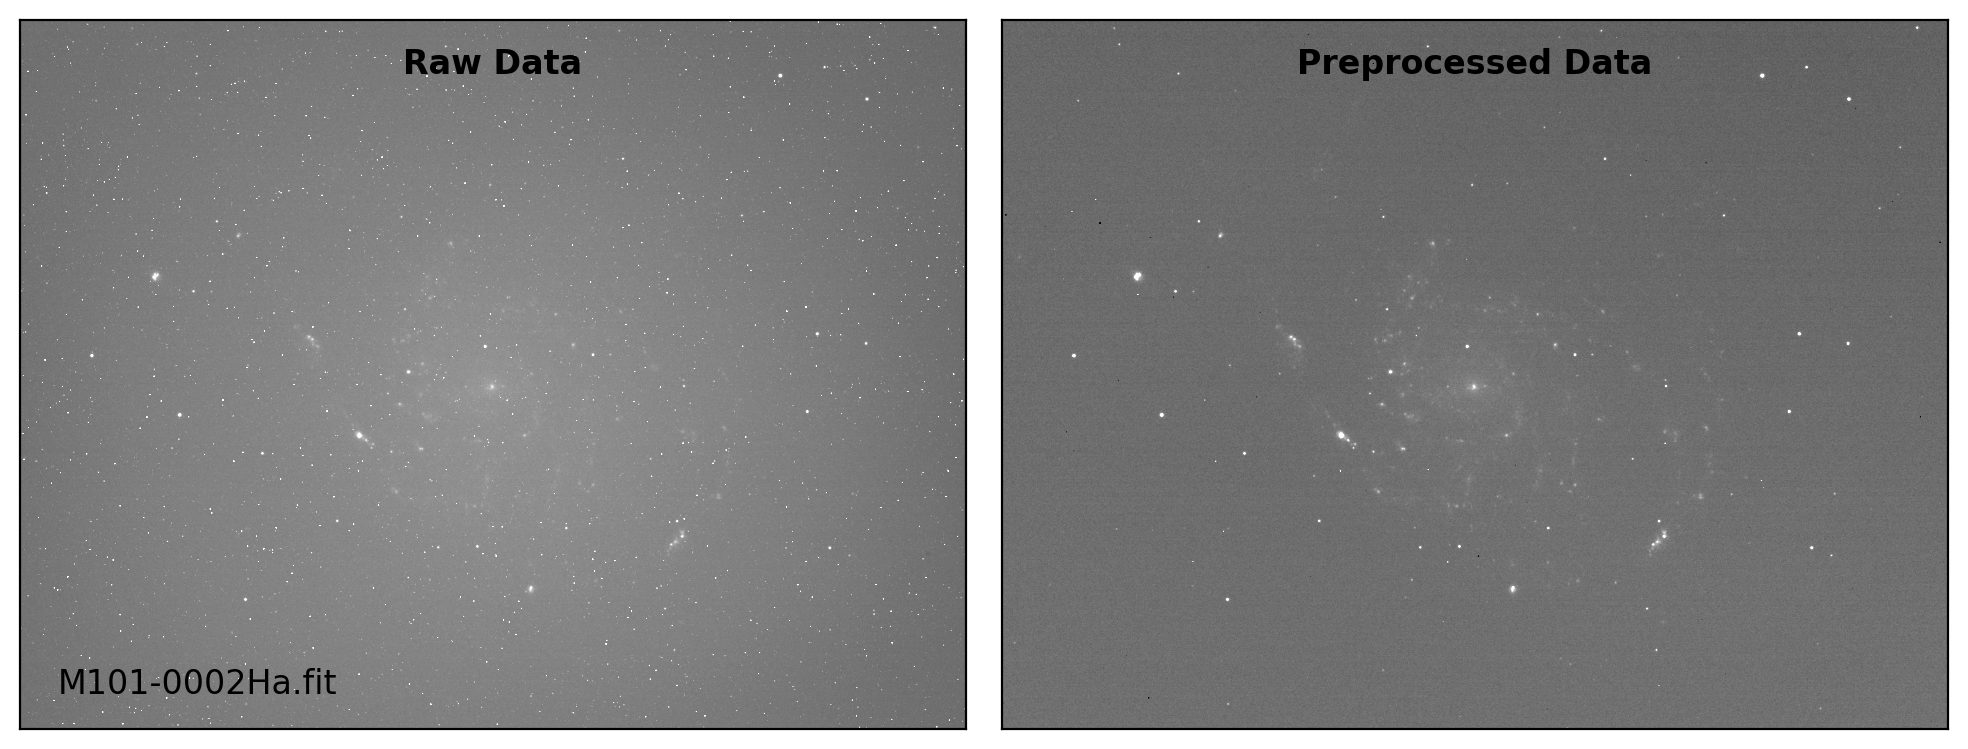
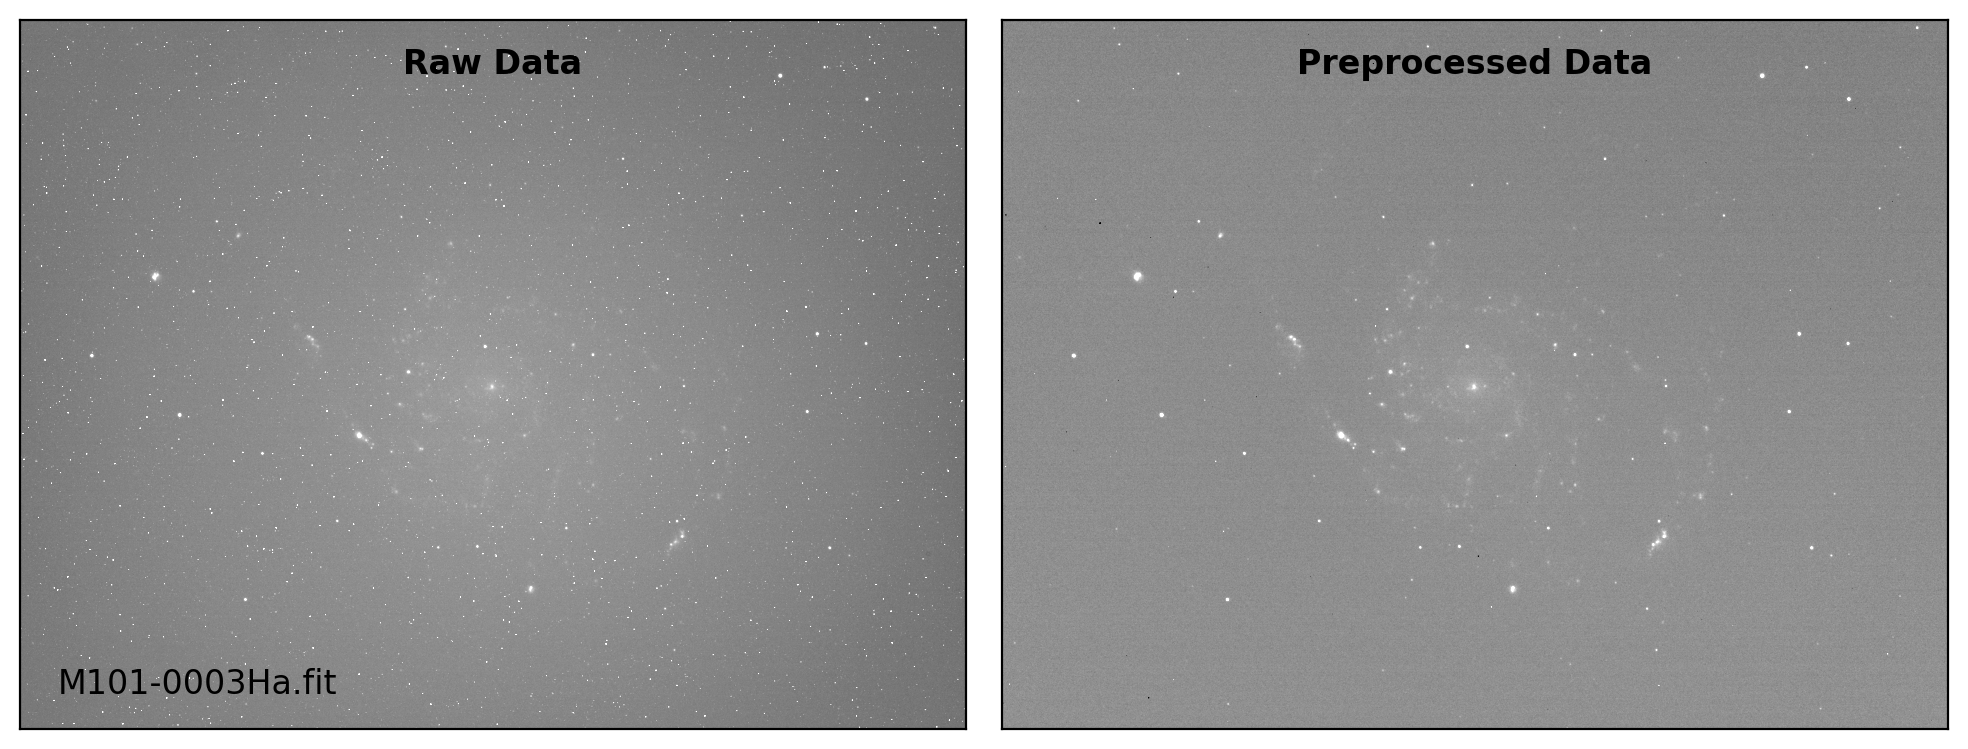
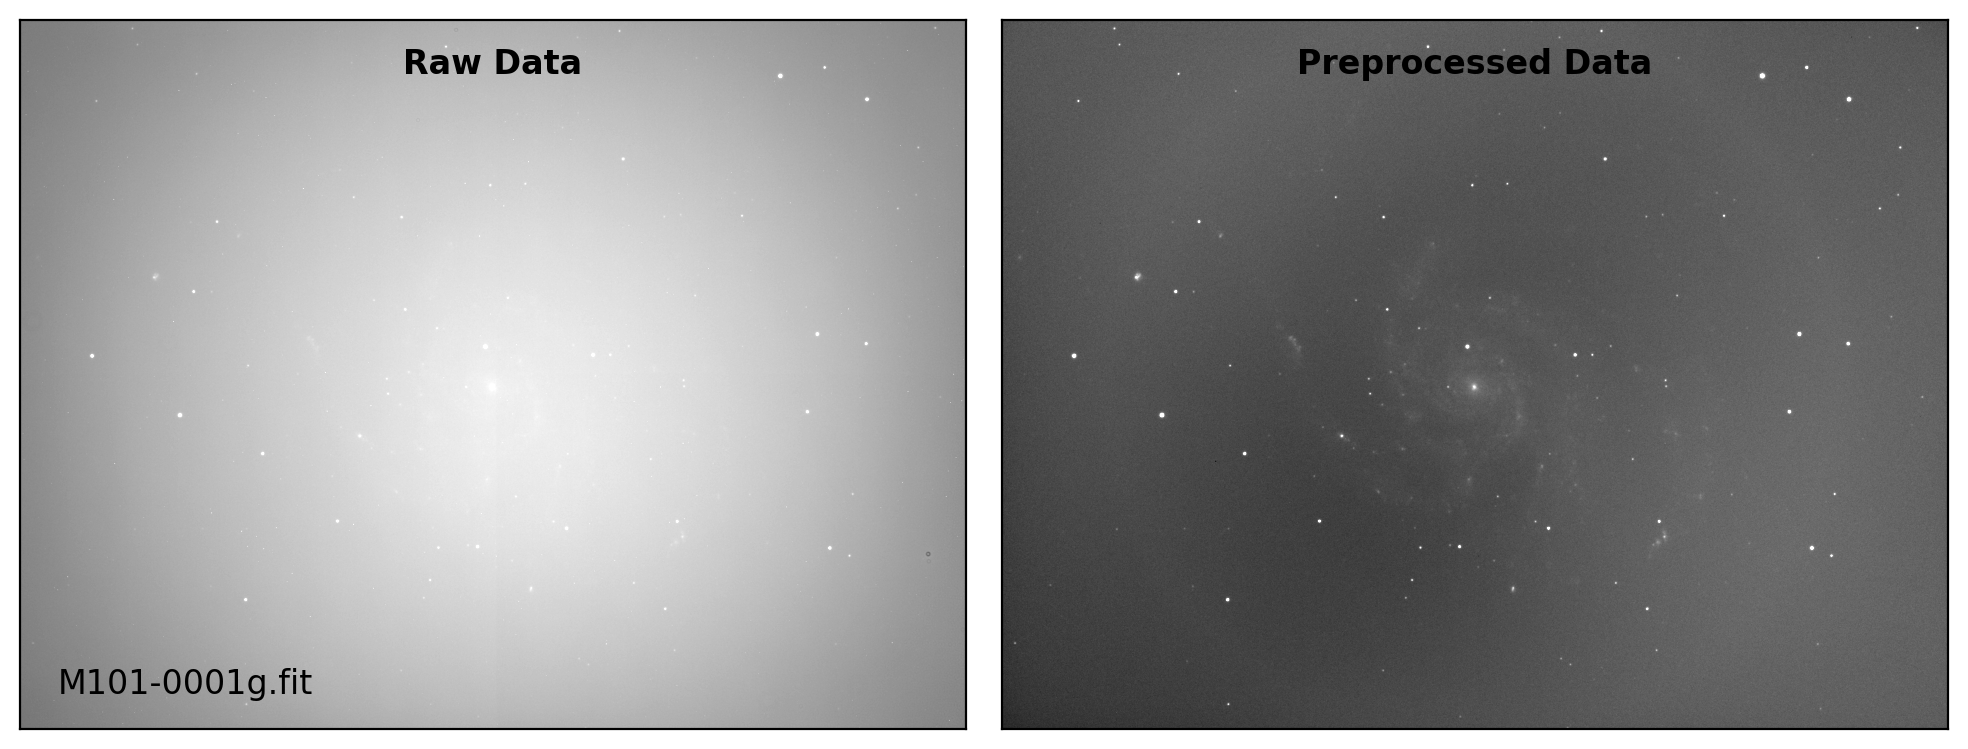
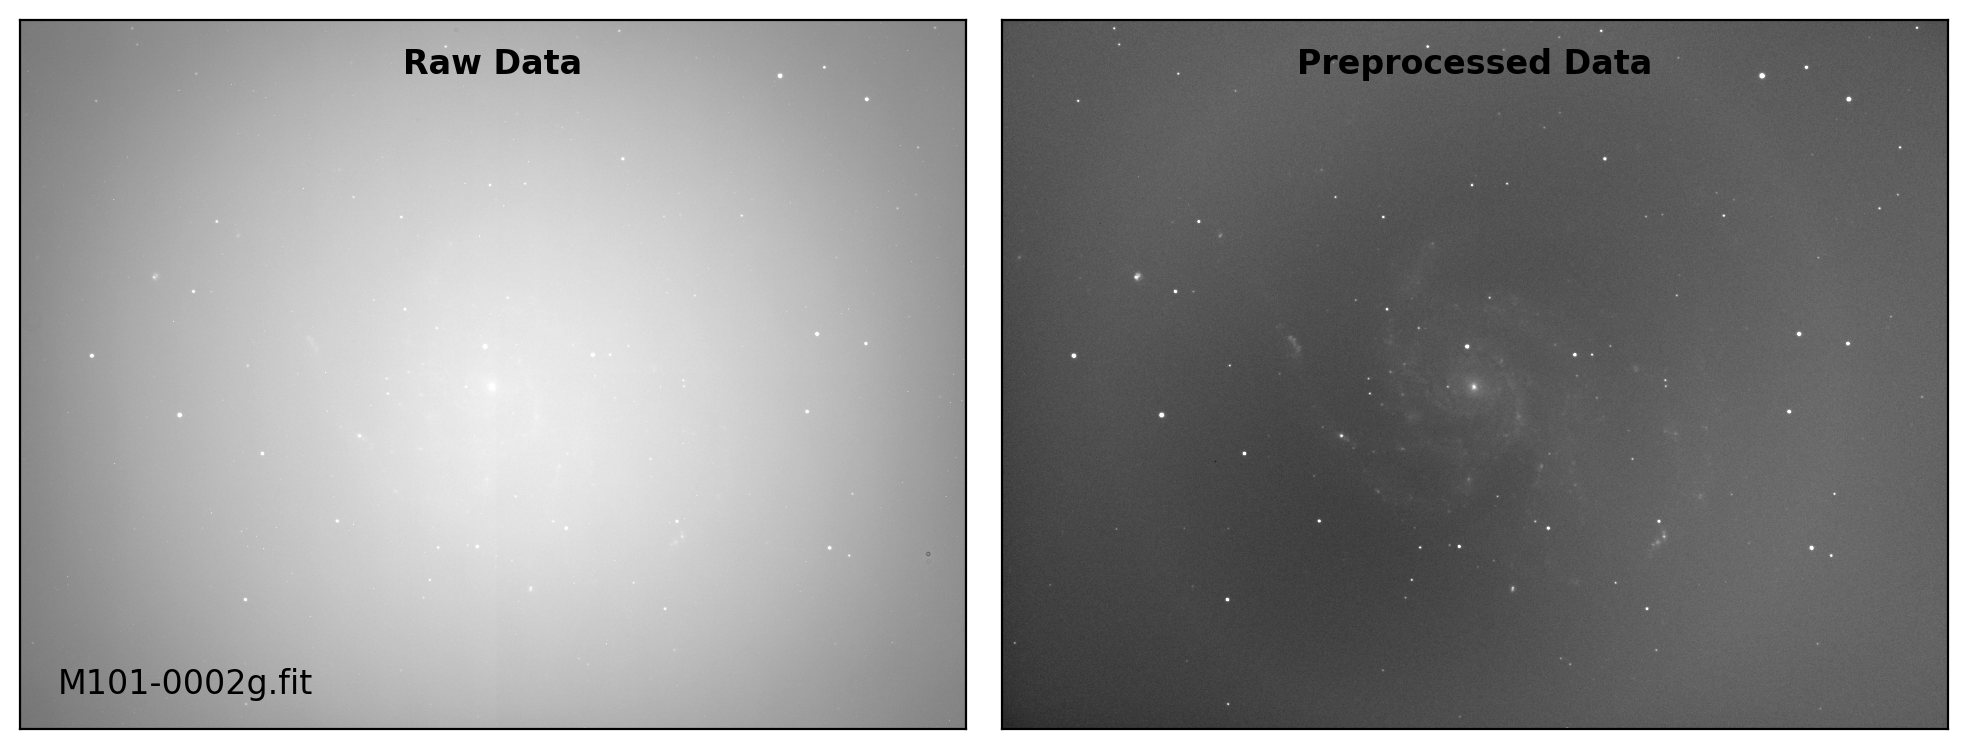
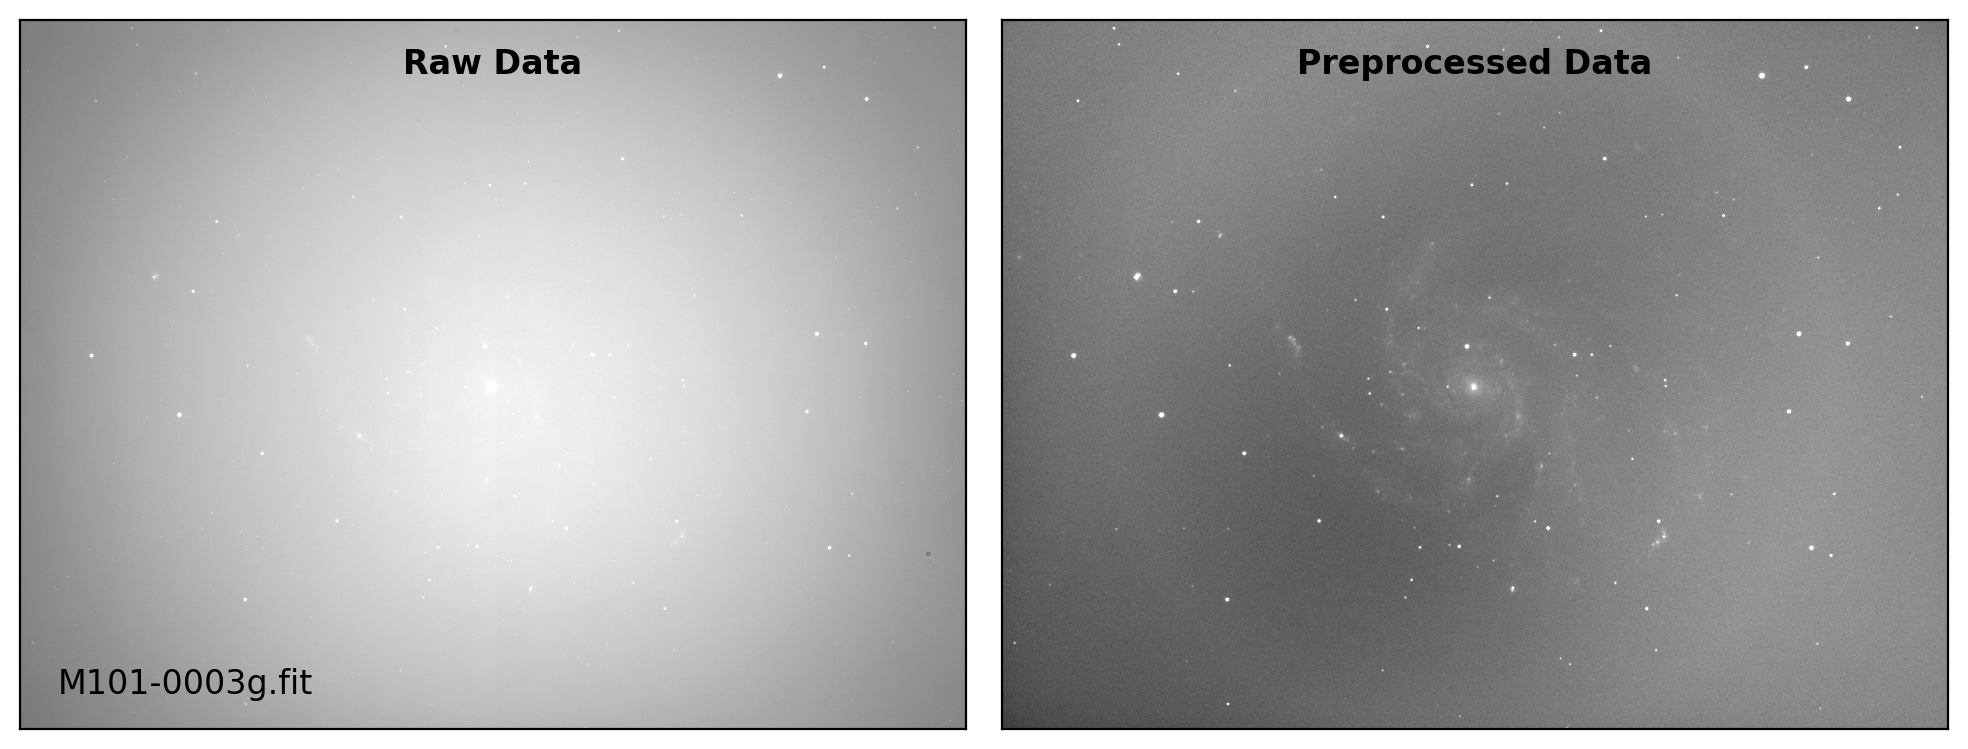
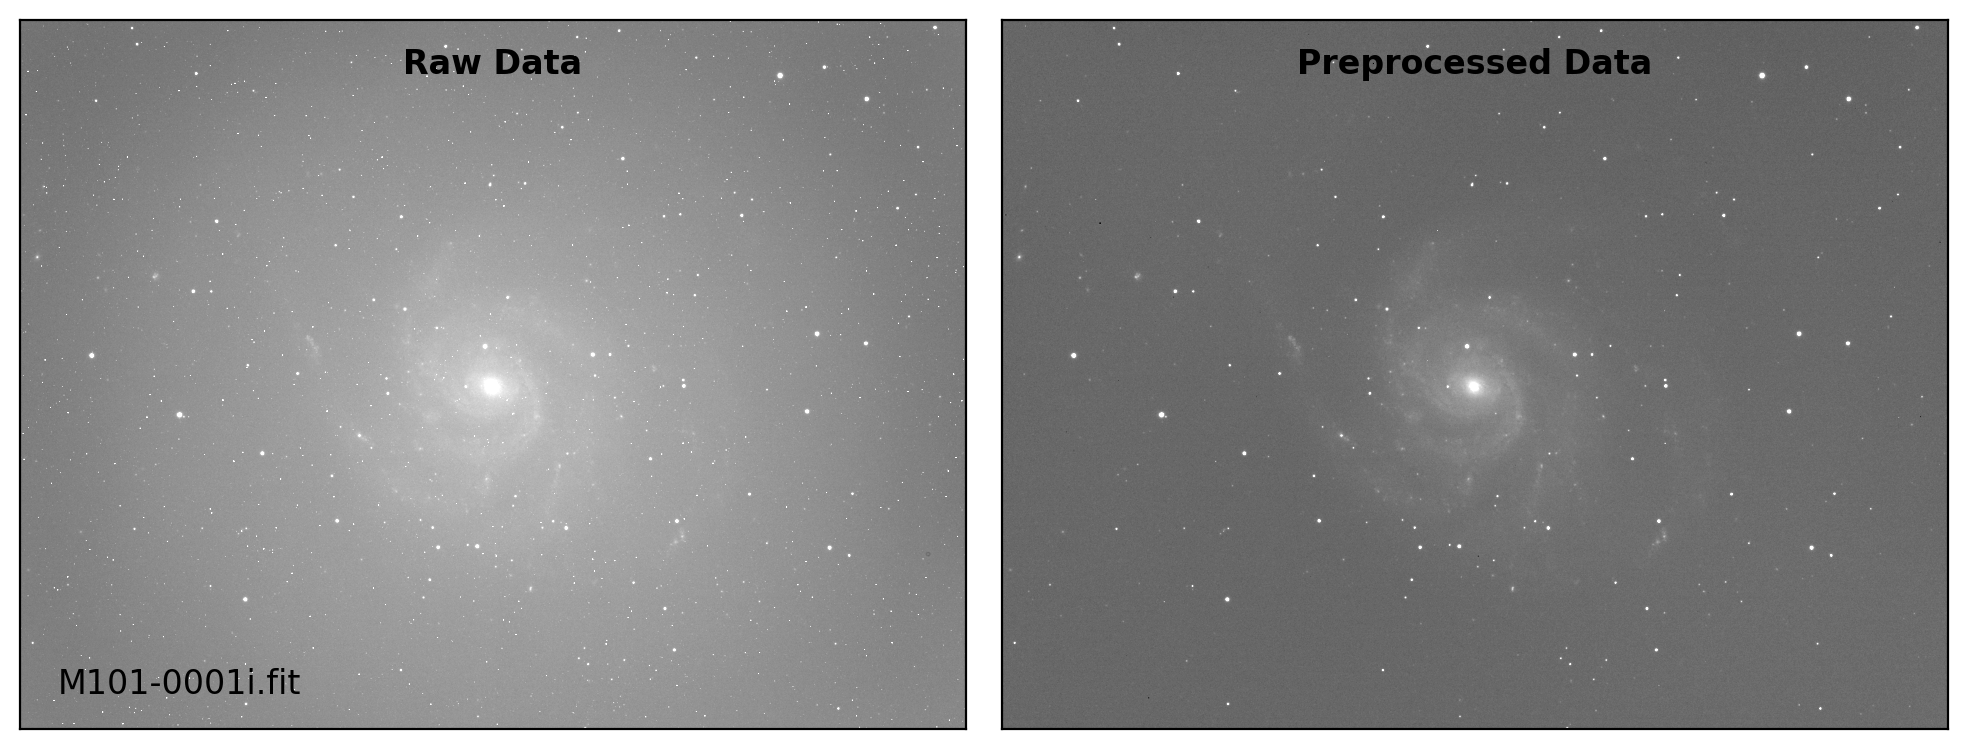
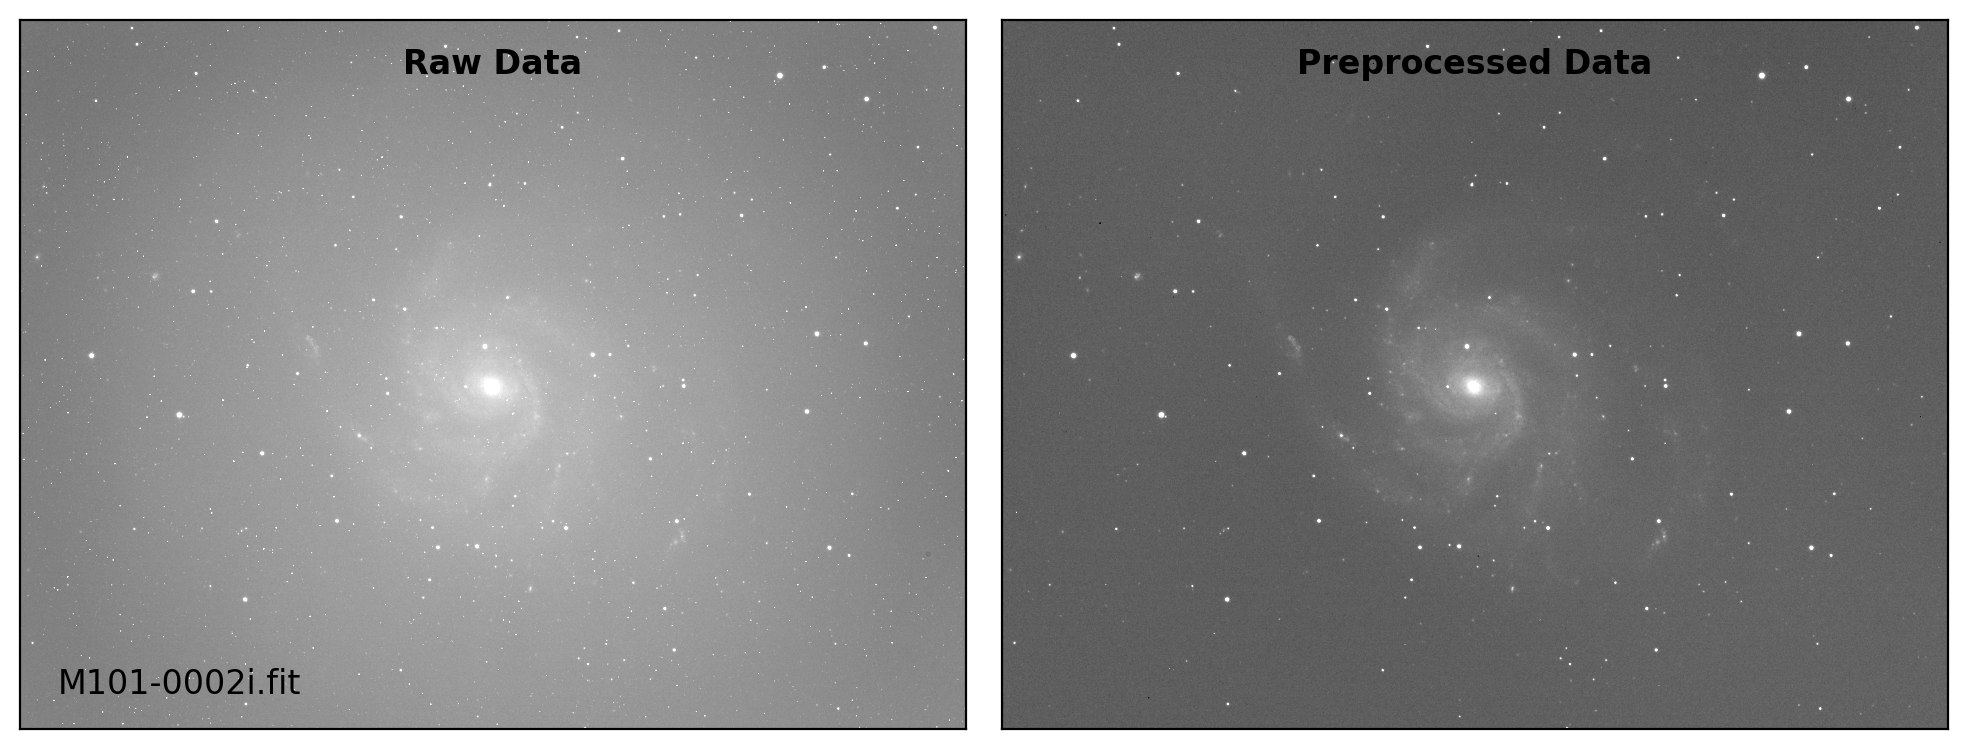
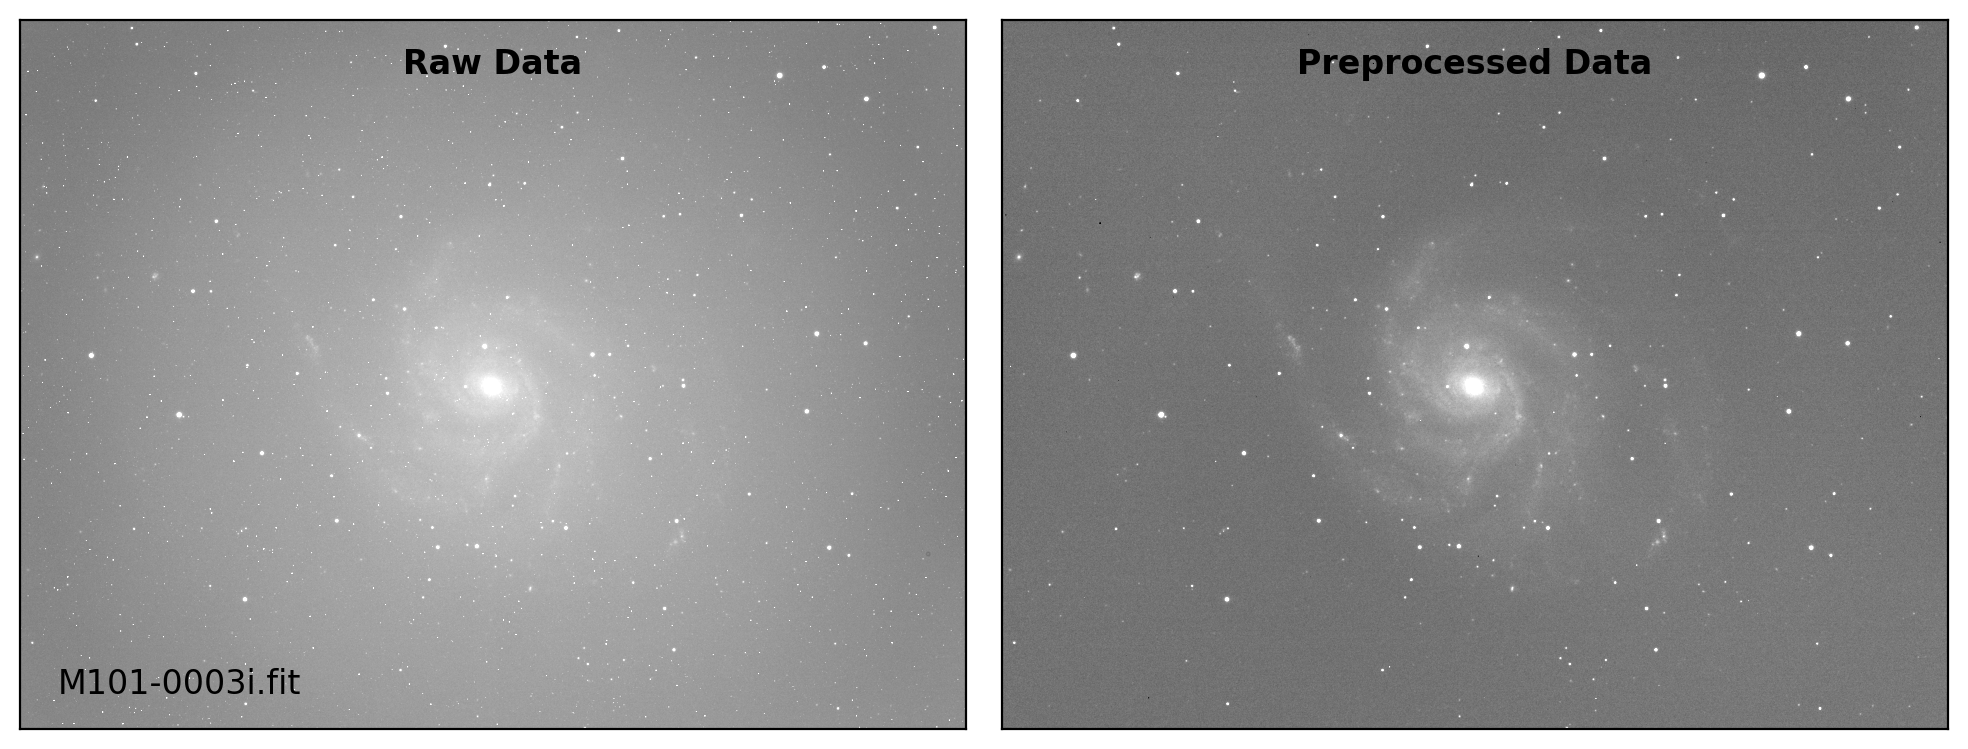
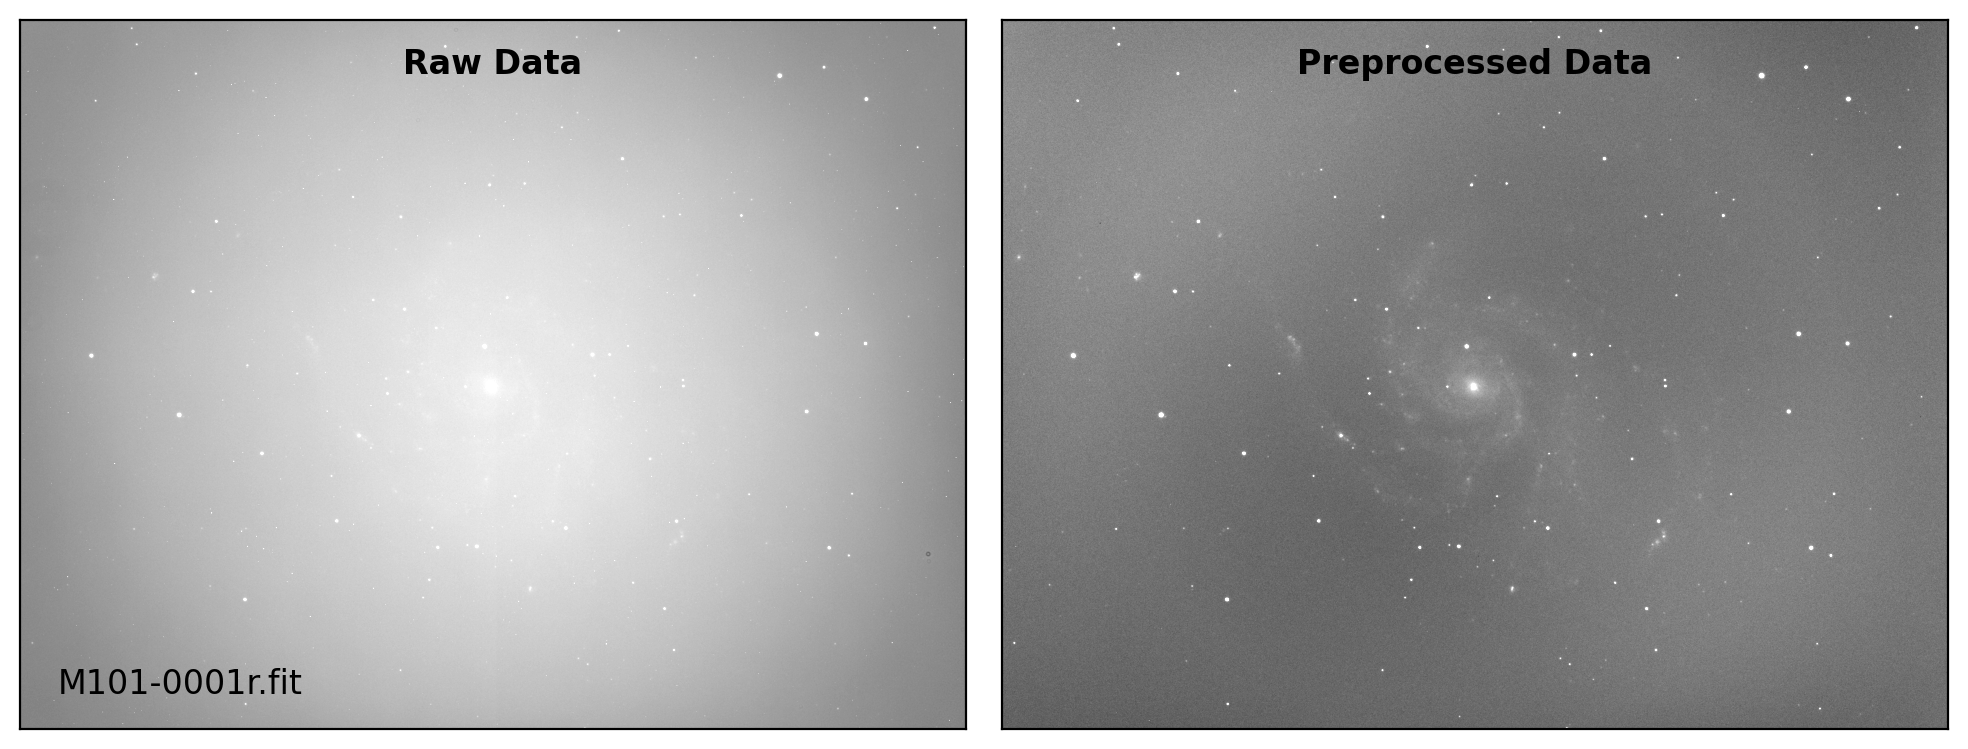
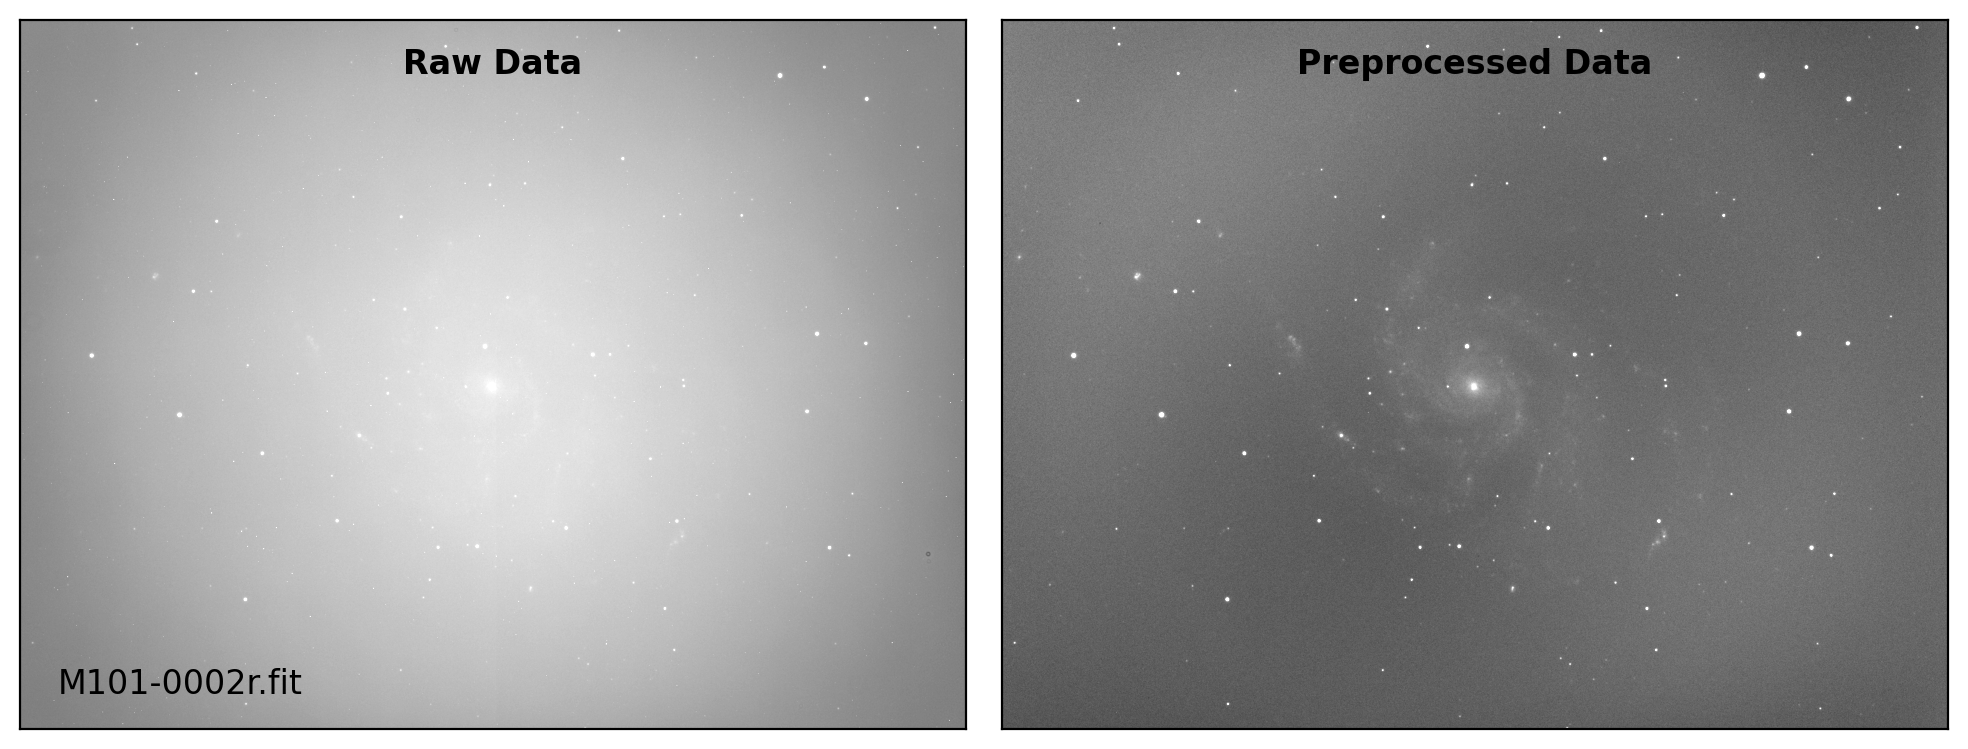
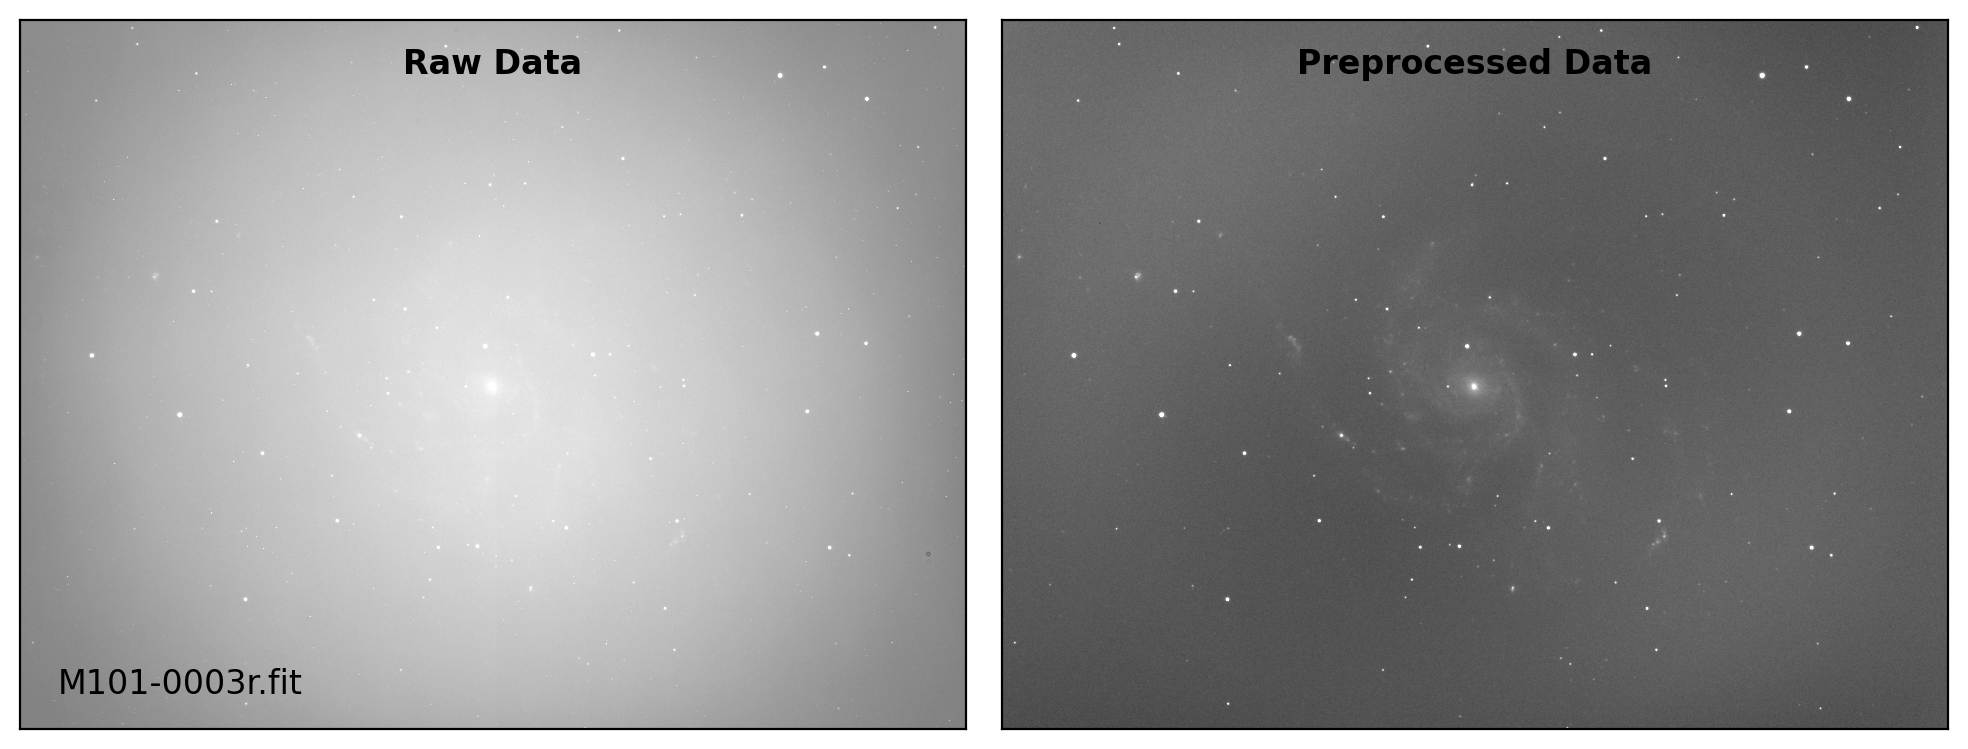
def preproc(sci_list, mbias=None, mdark=None, mflat=None, rdnoise=None,
            plot=False, verbose=True):
    for i in range(len(sci_list)):
        # bias subtraction, dark subtraction, and flat fielding
        sci_path = sci_list[i]
        sci_data, sci_hdr  = fits.getdata(sci_path, header=True)
        # 'int' type may cause error when calculating
        sci_data0 = sci_data.astype('float')

        mbias_data = 0. if mbias is None else fits.getdata(mbias)
        mdark_data = 0. if mdark is None else fits.getdata(mdark)
        mflat_data = 1. if mflat is None else fits.getdata(mflat)

        sci_data = sci_data0 - mbias_data    # Bias subtraction
        sci_data -= mdark_data   # Dark subtraction
        sci_data /= mflat_data    # Flat fielding

        # visual inspection
        if plot:
            fig, axs = plt.subplots(1, 2, figsize=(10,6))
            title = ["Raw Data", "Preprocessed Data"]
            for i, img in enumerate([sci_data0, sci_data]):
                ax = axs[i]
                vmin, vmax = interval.get_limits(img)
                ax.imshow(img, cmap='gray', origin='lower',
                          vmin=vmin, vmax=vmax)
                ax.tick_params(axis='both', length=0.0,
                               labelleft=False, labelbottom=False)
                if i == 0:
                    ax.text(0.04, 0.04, sci_path.name, fontsize=12.0,
                            transform=ax.transAxes, ha='left', va='bottom')
                ax.text(0.50, 0.96, title[i], fontsize=12.0, fontweight='bold',
                        transform=ax.transAxes, ha='center', va='top')
            plt.tight_layout()

        # recording preprocessing history
        now = time.strftime("%Y-%m-%d %H:%M:%S (GMT%z)")
        sci_hdr['RDNOISE'] = rdnoise
        sci_hdr['history'] = 'Preprocessed at ' + now

        # saving preprocessed image to a fits file
        fits.writeto(OUTDIR/('p'+sci_path.name+'s'), sci_data, sci_hdr,
                     overwrite=True)
        if verbose:
            print(f"Done: {sci_path.name}")
for group in sci_table.group_by('filter').groups:
    fnames = [RAWDIR/f for f in group['filename']]
    filter_now = group['filter'][0]
    exptime = group['exptime'][0]
    mdark_file = OUTDIR/f"MDark{exptime:.0f}.fits"
    mflat_file = OUTDIR/f"MFlat{filter_now}.fits"
    rdnoise = fits.getheader(mbias_file)['RDNOISE']
    preproc(fnames, mbias_file, mdark_file, mflat_file, rdnoise,
            plot=True, verbose=True)
Done: M101-0001Ha.fit
Done: M101-0002Ha.fit
Done: M101-0003Ha.fit
Done: M101-0001g.fit
Done: M101-0002g.fit
Done: M101-0003g.fit
Done: M101-0001i.fit
Done: M101-0002i.fit
Done: M101-0003i.fit
Done: M101-0001r.fit
Done: M101-0002r.fit
Done: M101-0003r.fit
def align_single_frame(img_fname, ccd_ref):
# alingning a single frame with respect to the reference frame
dat = fits.getdata(img_fname, ext=0)
ccd = CCDData(dat.byteswap().newbyteorder(), unit='adu')
dat_aligned, footprint = aa.register(ccd, ccd_ref,
max_control_points=50,
detection_sigma=5, min_area=16,
propagate_mask=True)
ccd_aligned = CCDData(dat_aligned, unit='adu')
return ccd_aligned
def align_frames(img_list, verbose=True, plot=False, window=[1277, 1437, 6000, 6160],
suptitle=None):
# reference image: frame 0
id_ref = 0
dat_ref, hdr_ref = fits.getdata(img_list[id_ref], header=True, ext=0)
ccd_ref = CCDData(dat_ref, unit='adu')
# Aligning other images with respect to the reference image
if verbose:
start_time = time.time()
print(f"--- Started aligning {len(img_list):d} images ---")
aligned_list = []
for i in range(len(img_list)):
if (i == id_ref):
ccd_aligned = ccd_ref
else:
ccd_aligned = align_single_frame(img_list[i], ccd_ref)
aligned_list.append(ccd_aligned)
if verbose:
end_time = time.time()
print(f"--- {end_time-start_time:.4f} sec were taken for aligning {len(img_list):d} images ---")
if plot:
plot_alignment_check(aligned_list, window=window, suptitle=suptitle)
return aligned_list
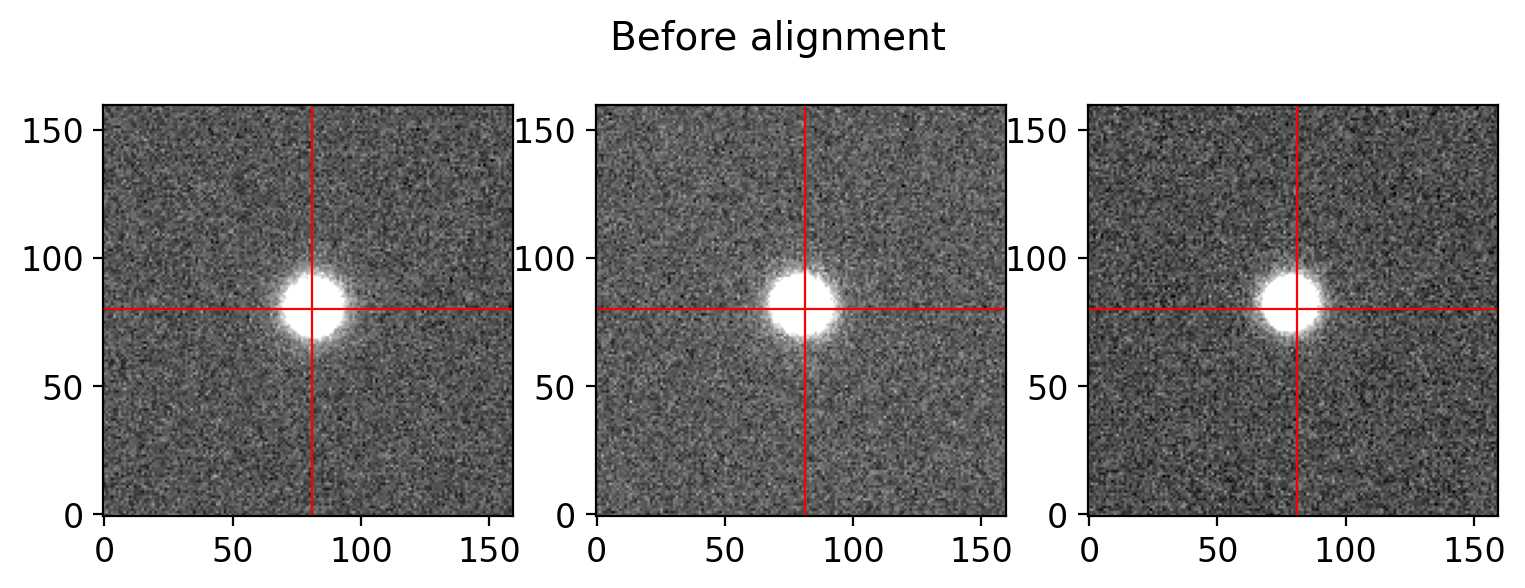
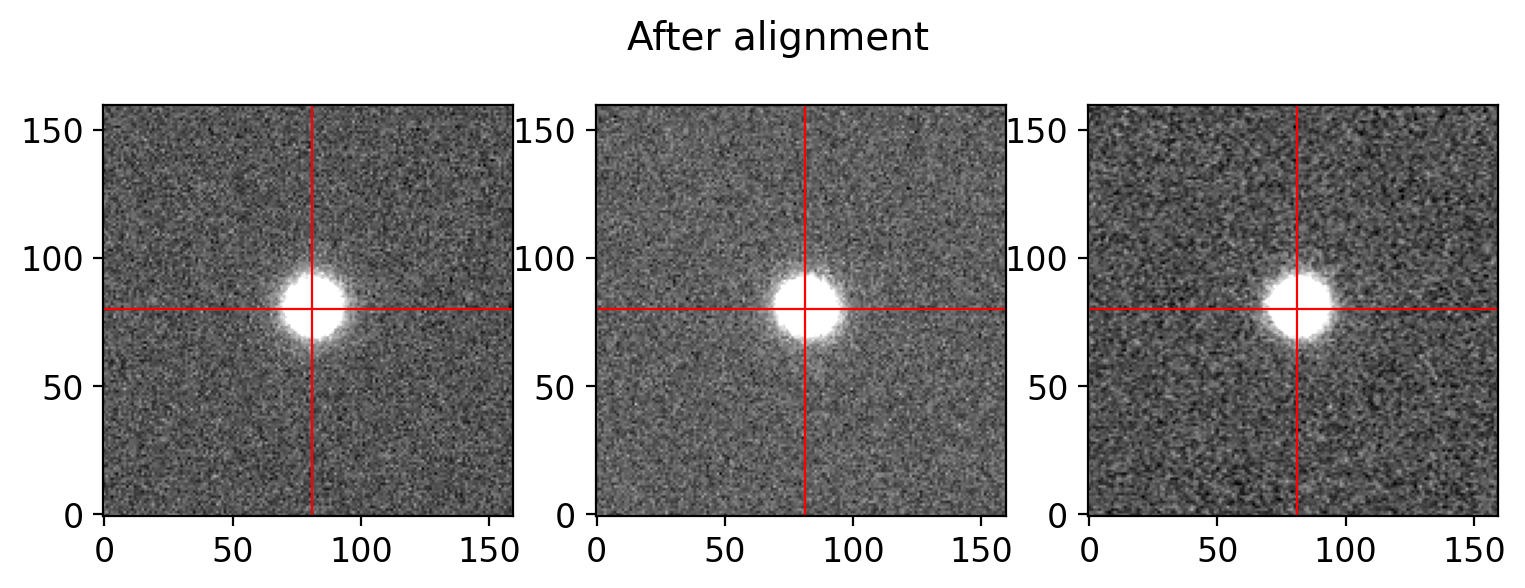
def plot_alignment_check(aligned_list, window=[1277, 1437, 6000, 6160], suptitle=None):
fig, axs = plt.subplots(1,len(aligned_list), figsize=(3*len(aligned_list),3))
for i in range(len(aligned_list)):
if isinstance(aligned_list[i], CCDData):
img = aligned_list[i].data
else:
img = aligned_list[i]
trim = img[window[0]:window[1], window[2]:window[3]]
vmin, vmax = interval.get_limits(trim)
ax = axs[i]
ax.imshow(trim, origin='lower', vmin=vmin, vmax=vmax, cmap='gray')
if i == 0:
xc, yc = np.unravel_index(np.argmax(trim), trim.shape)
ax.axvline(yc, c='r', lw=0.8)
ax.axhline(xc, c='r', lw=0.8)
if suptitle is not None:
fig.suptitle(suptitle, fontsize=14)
# testing the alignment of the g-band science frames
group = sci_table[sci_table['filter']=='g']
sci_list = [OUTDIR/f'p{f}s' for f in group['filename']]
sci_data = [fits.getdata(f) for f in sci_list]

# checking the alignment of the science frames
plot_alignment_check(sci_data, suptitle='Before alignment')

# aligning the science frames
sci_aligned = align_frames(sci_list, verbose=True, plot=True,
                           window=[1277, 1437, 6000, 6160], suptitle='After alignment')
--- Started aligning 3 images ---
--- 6.5767 sec were taken for aligning 3 images ---
# align and combine the science frames
for group in sci_table.group_by('filter').groups:
    filter_now = group['filter'][0]
    sci_list = [OUTDIR/f'p{f}s' for f in group['filename']] # preprocessed sci frames
    # aligning the science frames
    print(f"Aligning {len(sci_list)} science frames ({filter_now}-band)")
    sci_aligned = align_frames(sci_list, verbose=True, plot=False)

    # combining the aligned frames
    combined = combine(sci_aligned, sigma_clip=True,
                       sigma_clip_low_thresh=3, sigma_clip_high_thresh=3)

    # saving the combined science frame
    object_name = group['object'][0].replace(' ', '')
    sci_hdr = fits.getheader(sci_list[0])
    sci_hdr['NFRAMES'] = len(sci_list)
    sci_hdr['HISTORY'] = 'Aligned and combined'
    fits.writeto(OUTDIR/f'M{object_name}_{filter_now}.fits', combined.data,
                 sci_hdr, overwrite=True)
Aligning 3 science frames (Ha-band)
--- Started aligning 3 images ---
--- 7.5915 sec were taken for aligning 3 images ---
Aligning 3 science frames (g-band)
--- Started aligning 3 images ---
--- 6.8045 sec were taken for aligning 3 images ---
Aligning 3 science frames (i-band)
--- Started aligning 3 images ---
--- 7.1318 sec were taken for aligning 3 images ---
Aligning 3 science frames (r-band)
--- Started aligning 3 images ---
--- 7.0729 sec were taken for aligning 3 images ---
def sdss_rgb(imgs, bands, scales=None, m=0.02, Q=20):
    import numpy as np
    rgbscales = {'u': (2,1.5), #1.0,
                 'g': (2,2.5),
                 'r': (1,1.5),
                 'i': (0,1.0),
                 'z': (0,0.4), #0.3
                 }
    if scales is not None:
        rgbscales.update(scales)

    I = 0
    for img,band in zip(imgs, bands):
        plane,scale = rgbscales[band]
        img = np.maximum(0, img * scale + m)
        I = I + img
    I /= len(bands)

    fI = np.arcsinh(Q * I) / np.sqrt(Q)
    I += (I == 0.) * 1e-6
    H,W = I.shape
    rgb = np.zeros((H,W,3), np.float32)
    for img,band in zip(imgs, bands):
        plane,scale = rgbscales[band]
        rgb[:,:,plane] = (img * scale + m) * fI / I

    rgb = np.clip(rgb, 0, 1)
    return rgb
def background_substraction(img, box=100, filt=3, show=True):
from astropy.stats import SigmaClip
from photutils.segmentation import detect_threshold, detect_sources
from photutils.utils import circular_footprint
import sep
sigma_clip = SigmaClip(sigma=3.0, maxiters=10)
threshold = detect_threshold(img, nsigma=3.0, sigma_clip=sigma_clip)
segment_img = detect_sources(img, threshold, npixels=10)
footprint = circular_footprint(radius=3)
mask = segment_img.make_source_mask(footprint=footprint)
# mask = SegmentationImage.make_source_mask(img, nsigma=2, npixels=1, dilate_size=3)
bkg_sep = sep.Background(img.byteswap().newbyteorder(),
mask=mask, bw=box, bh=box, fw=filt, fh=filt)
bkgsub_sep = img - bkg_sep.back()
if show:
fig, axs = plt.subplots(2, 3, figsize=(10, 8))
axs[1, 1].axis("off")
data2plot = [
dict(ax=axs[0, 0], arr=img, title="Original data"),
dict(ax=axs[0, 1], arr=bkg_sep.back(), title=f"bkg (filt={filt:d}, box={box:d})"),
dict(ax=axs[0, 2], arr=bkgsub_sep, title="bkg subtracted"),
dict(ax=axs[1, 0], arr=mask, title="Mask"),
# dict(ax=axs[1, 1], arr=bkg_sep.background_mesh, title="bkg mesh"),
dict(ax=axs[1, 2], arr=10*bkg_sep.rms(), title="10 * bkg RMS")
]
for dd in data2plot:
im = zscale_imshow(dd['ax'], dd['arr'])
cb = fig.colorbar(im, ax=dd['ax'], orientation='horizontal')
# cb.ax.set_xticklabels([f'{x:.3f}' for x in cb.get_ticks()])#, rotation=45)
dd['ax'].set_title(dd['title'])
plt.tight_layout()
return bkgsub_sep
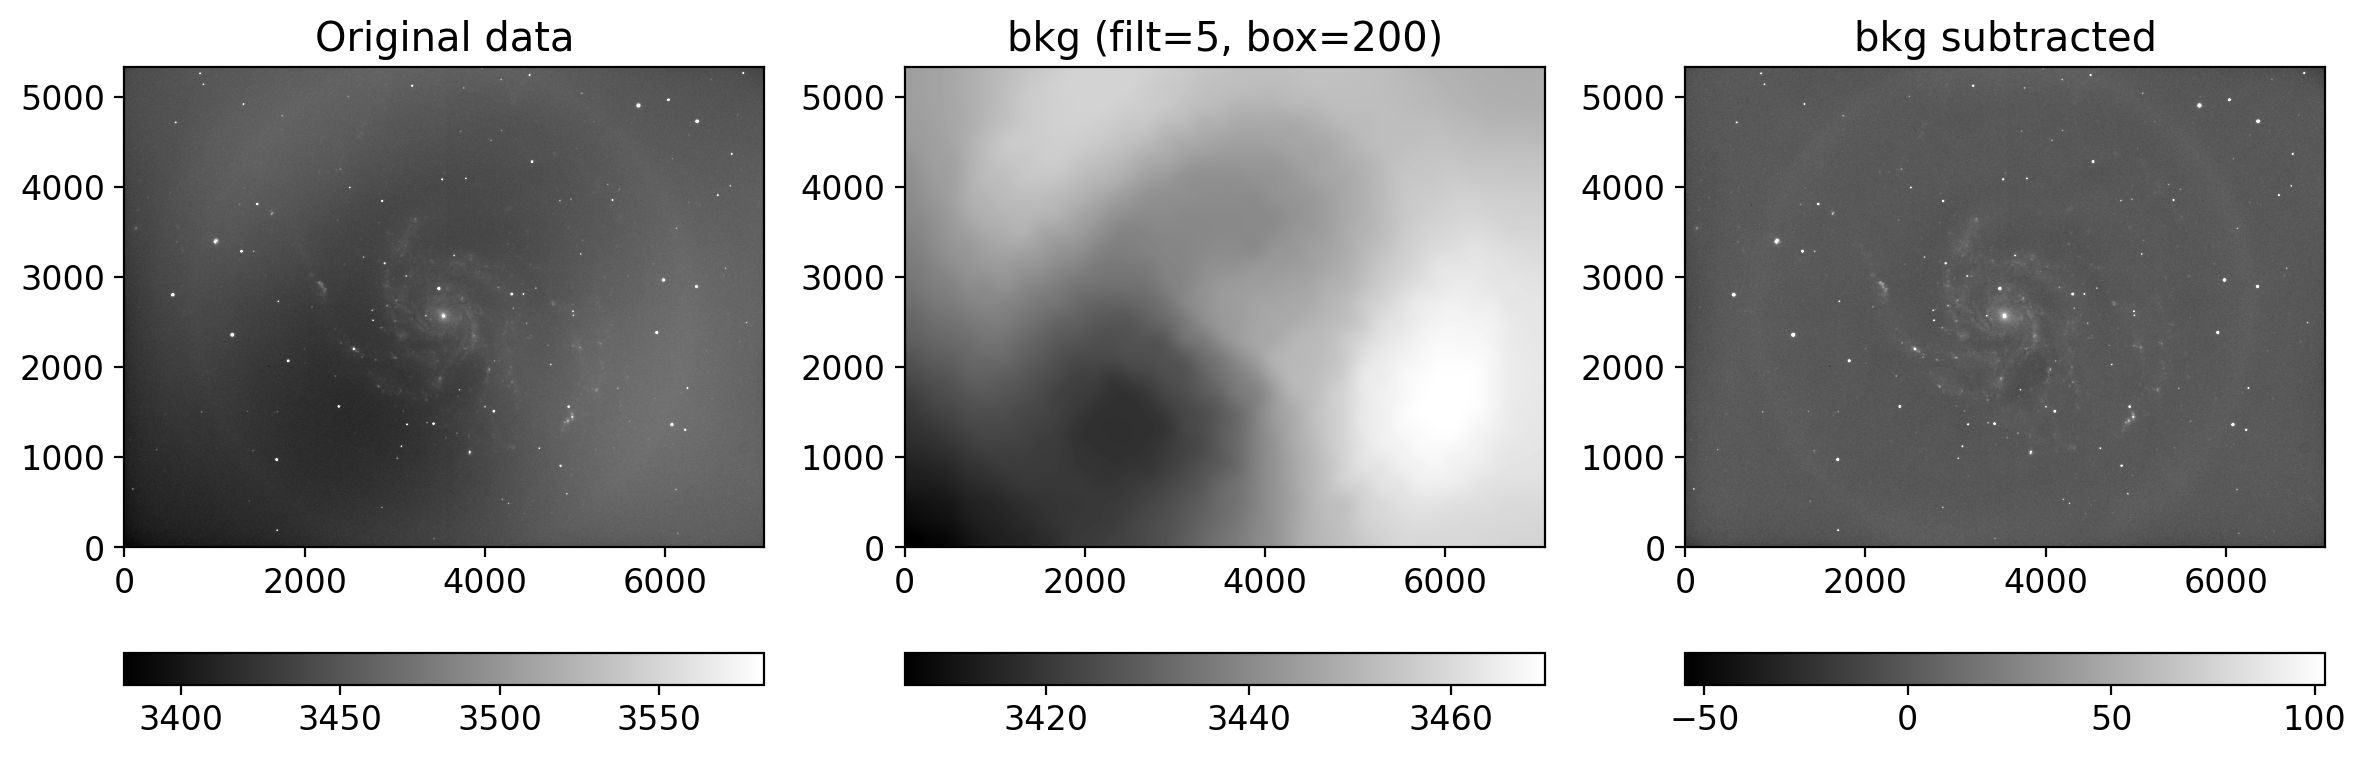
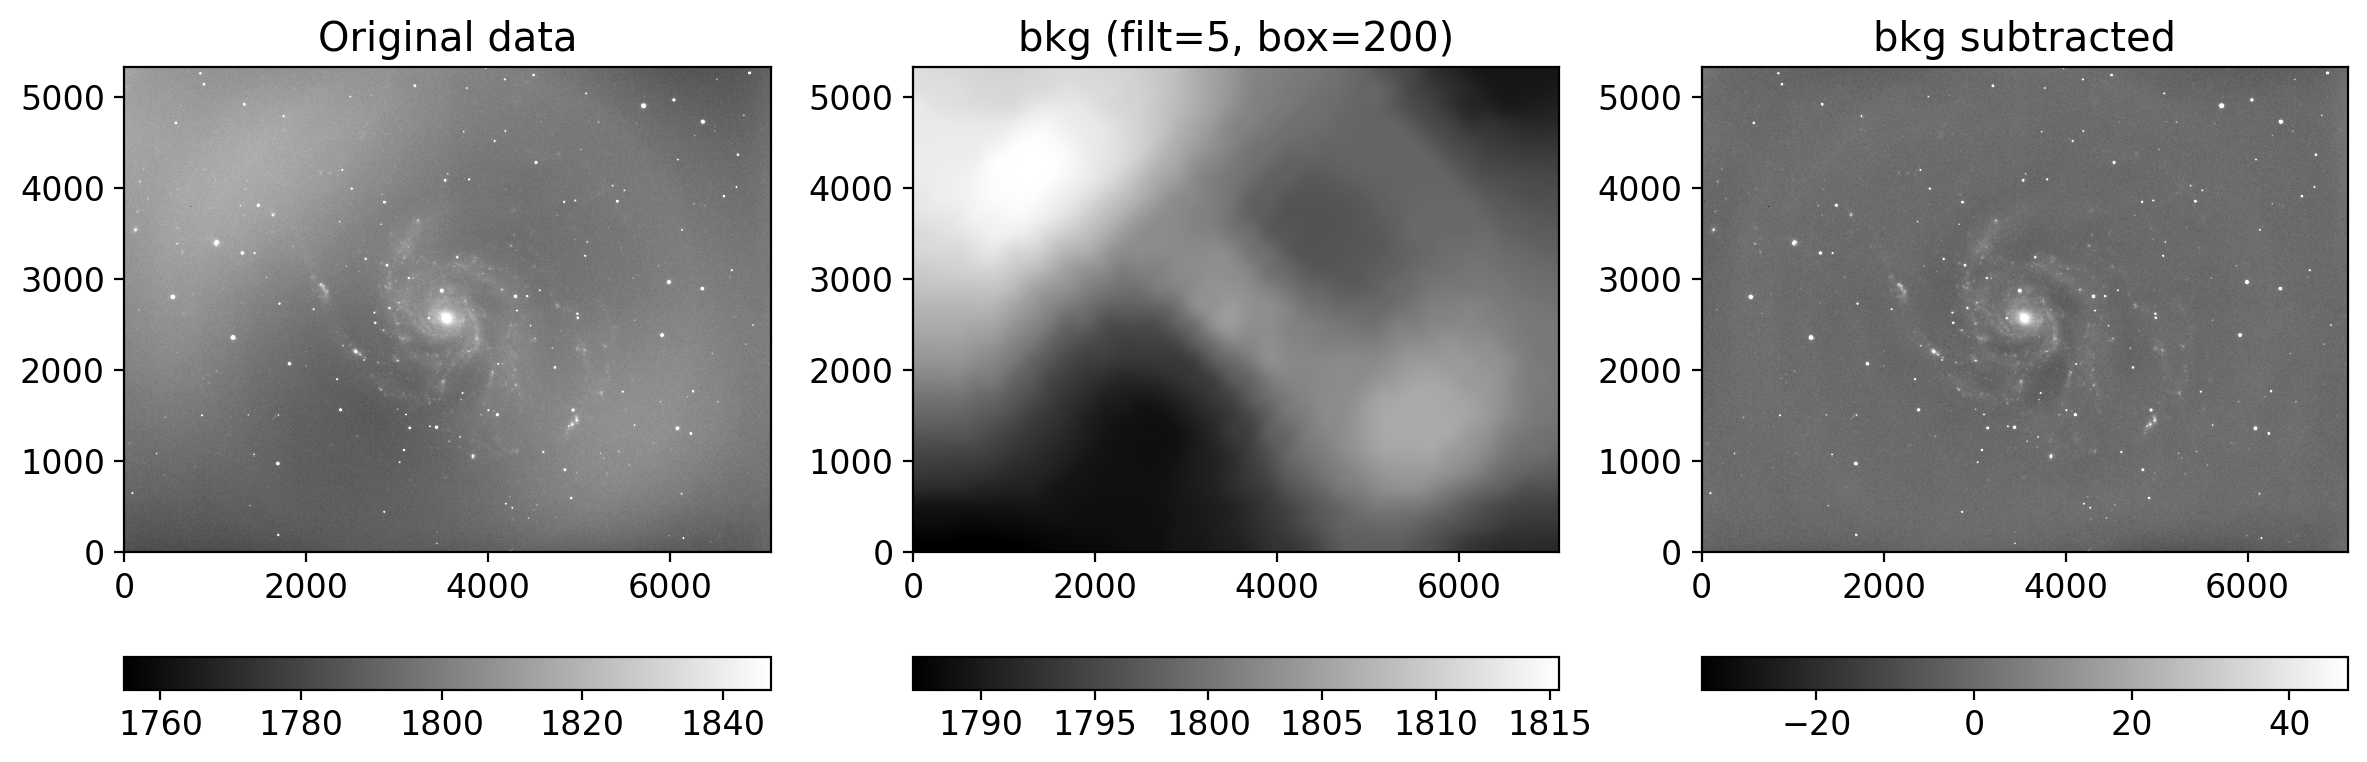
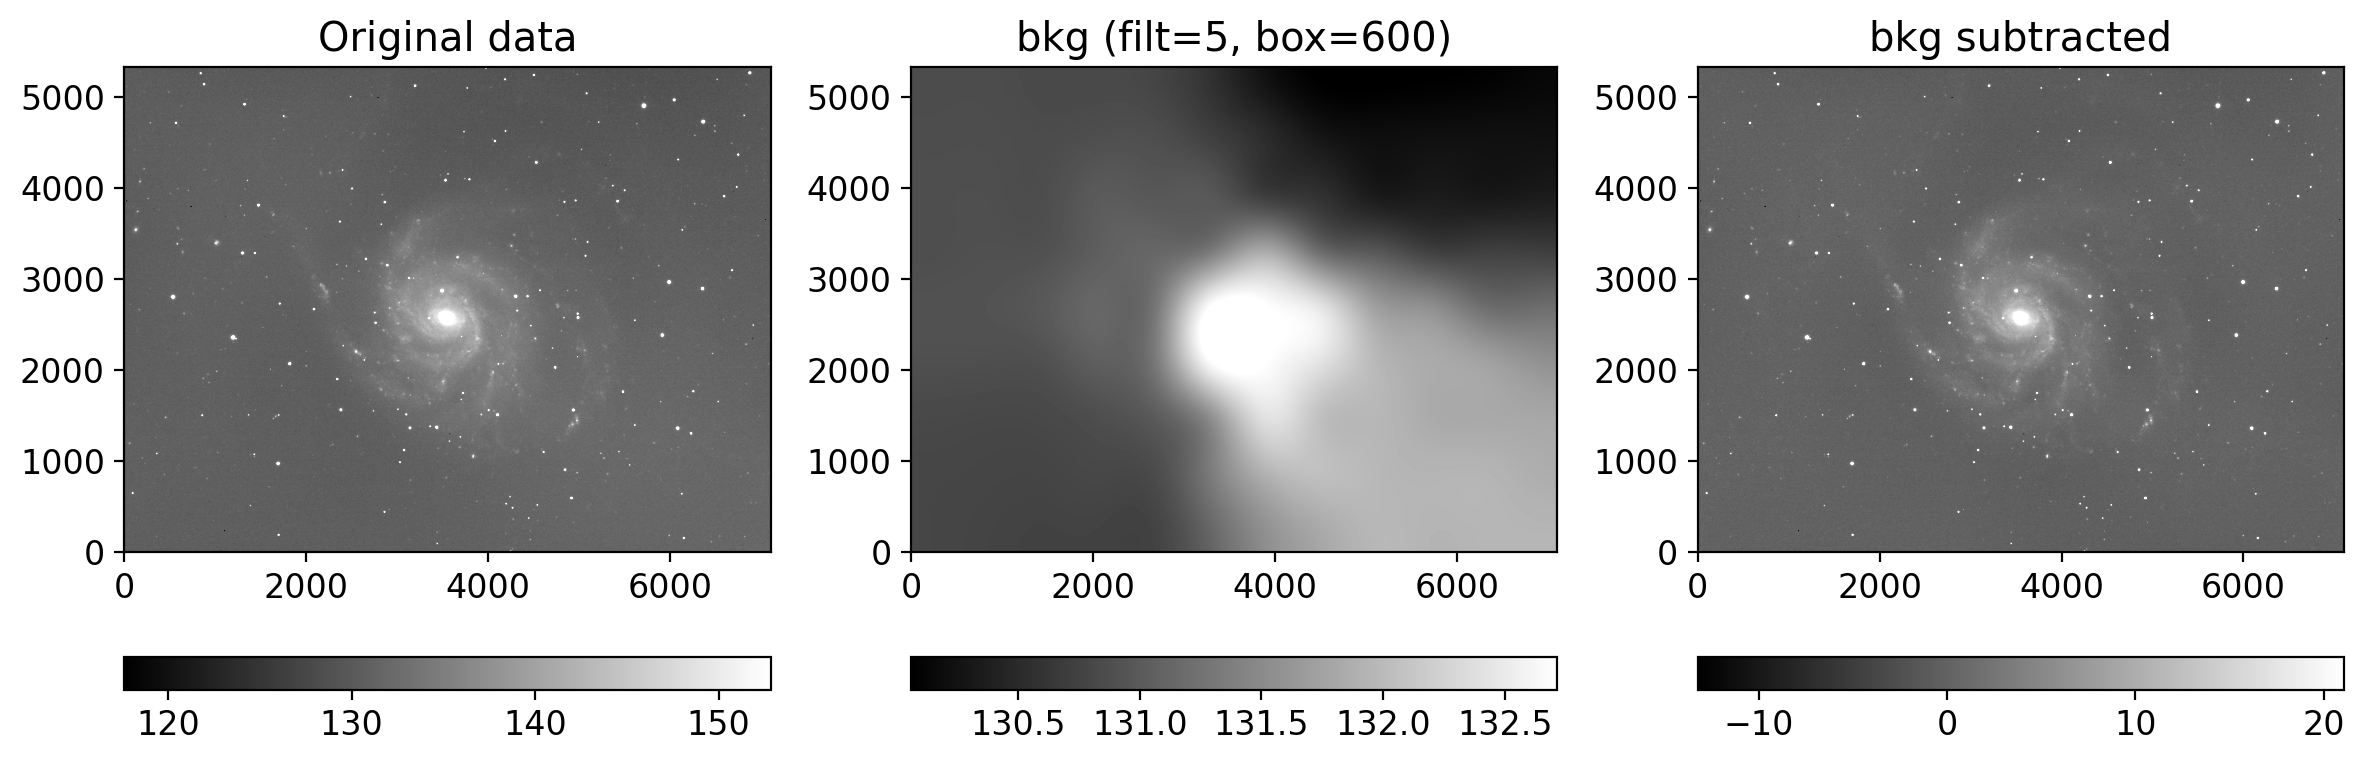
def plot_background_estimation(img, bkg, filt, box):
fig, axs = plt.subplots(1, 3, figsize=(12, 4))
data2plot = [
dict(ax=axs[0], arr=img, title="Original data"),
dict(ax=axs[1], arr=bkg, title=f"bkg (filt={filt:d}, box={box:d})"),
dict(ax=axs[2], arr=img-bkg, title="bkg subtracted"),
]
for dd in data2plot:
im = zscale_imshow(dd['ax'], dd['arr'])
cb = fig.colorbar(im, ax=dd['ax'], orientation='horizontal')
# cb.ax.set_xticklabels([f'{x:.3f}' for x in cb.get_ticks()])#, rotation=45)
dd['ax'].set_title(dd['title'])
fig.tight_layout()
def zscale_imshow(ax, data, **kwargs):
interval = ZScaleInterval()
vmin, vmax = interval.get_limits(data)
im = ax.imshow(data, cmap='gray', origin='lower', vmin=vmin, vmax=vmax, **kwargs)
return im
gimg = fits.getdata(OUTDIR / 'MM101_g.fits')
rimg = fits.getdata(OUTDIR / 'MM101_r.fits')
iimg = fits.getdata(OUTDIR / 'MM101_i.fits')

#downscale
nsample = 1
from skimage.transform import downscale_local_mean
gimg = downscale_local_mean(gimg, (nsample, nsample))
rimg = downscale_local_mean(rimg, (nsample, nsample))
iimg = downscale_local_mean(iimg, (nsample, nsample))


grbox = 200 / nsample
ibox = 600 / nsample
filtsize = (5,5)

imgcenter = [gimg.shape[0]//2, gimg.shape[1]//2]
mask_radius = 120 / nsample
mask = np.zeros_like(gimg, dtype=bool)
xx, yy = np.meshgrid(np.arange(gimg.shape[1]), np.arange(gimg.shape[0]))
mask[(xx - imgcenter[1])**2 + (yy - imgcenter[0])**2 < mask_radius**2] = True

from photutils.background import Background2D, MedianBackground
bkg_estimator = MedianBackground()
gbkg = Background2D(gimg, (grbox, grbox), mask=mask, filter_size=filtsize,
                    bkg_estimator=bkg_estimator)
rbkg = Background2D(rimg, (grbox, grbox), mask=mask, filter_size=filtsize,
                    bkg_estimator=bkg_estimator)
ibkg = Background2D(iimg, (ibox, ibox), mask=mask, filter_size=filtsize,
                    bkg_estimator=bkg_estimator)

gimg_bkgsub = gimg - gbkg.background  # subtract the background
rimg_bkgsub = rimg - rbkg.background
iimg_bkgsub = iimg - ibkg.background


plot_background_estimation(gimg, gbkg.background, filtsize[0], grbox)
plot_background_estimation(rimg, rbkg.background, filtsize[0], grbox)
plot_background_estimation(iimg, ibkg.background, filtsize[0], ibox)
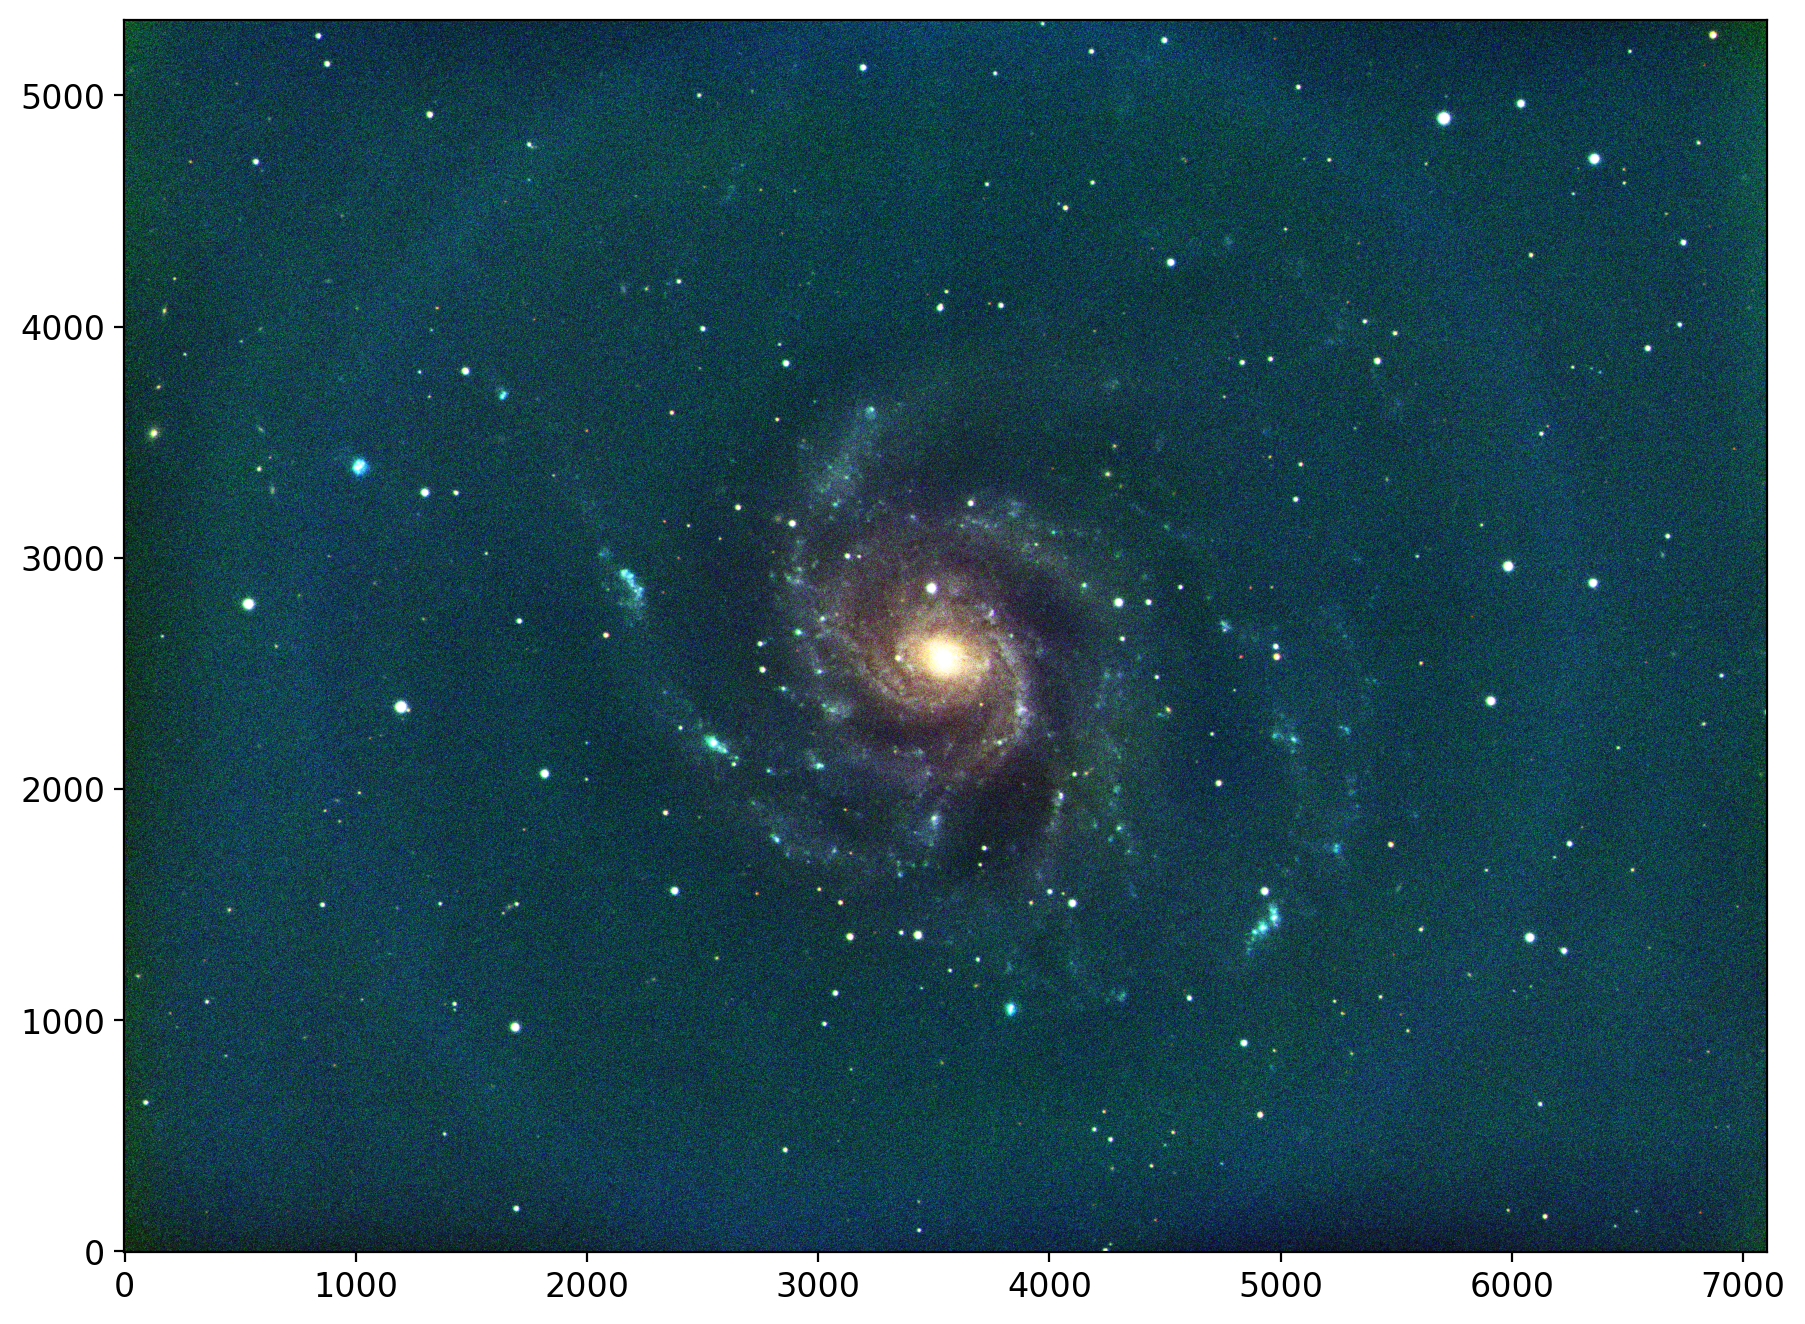
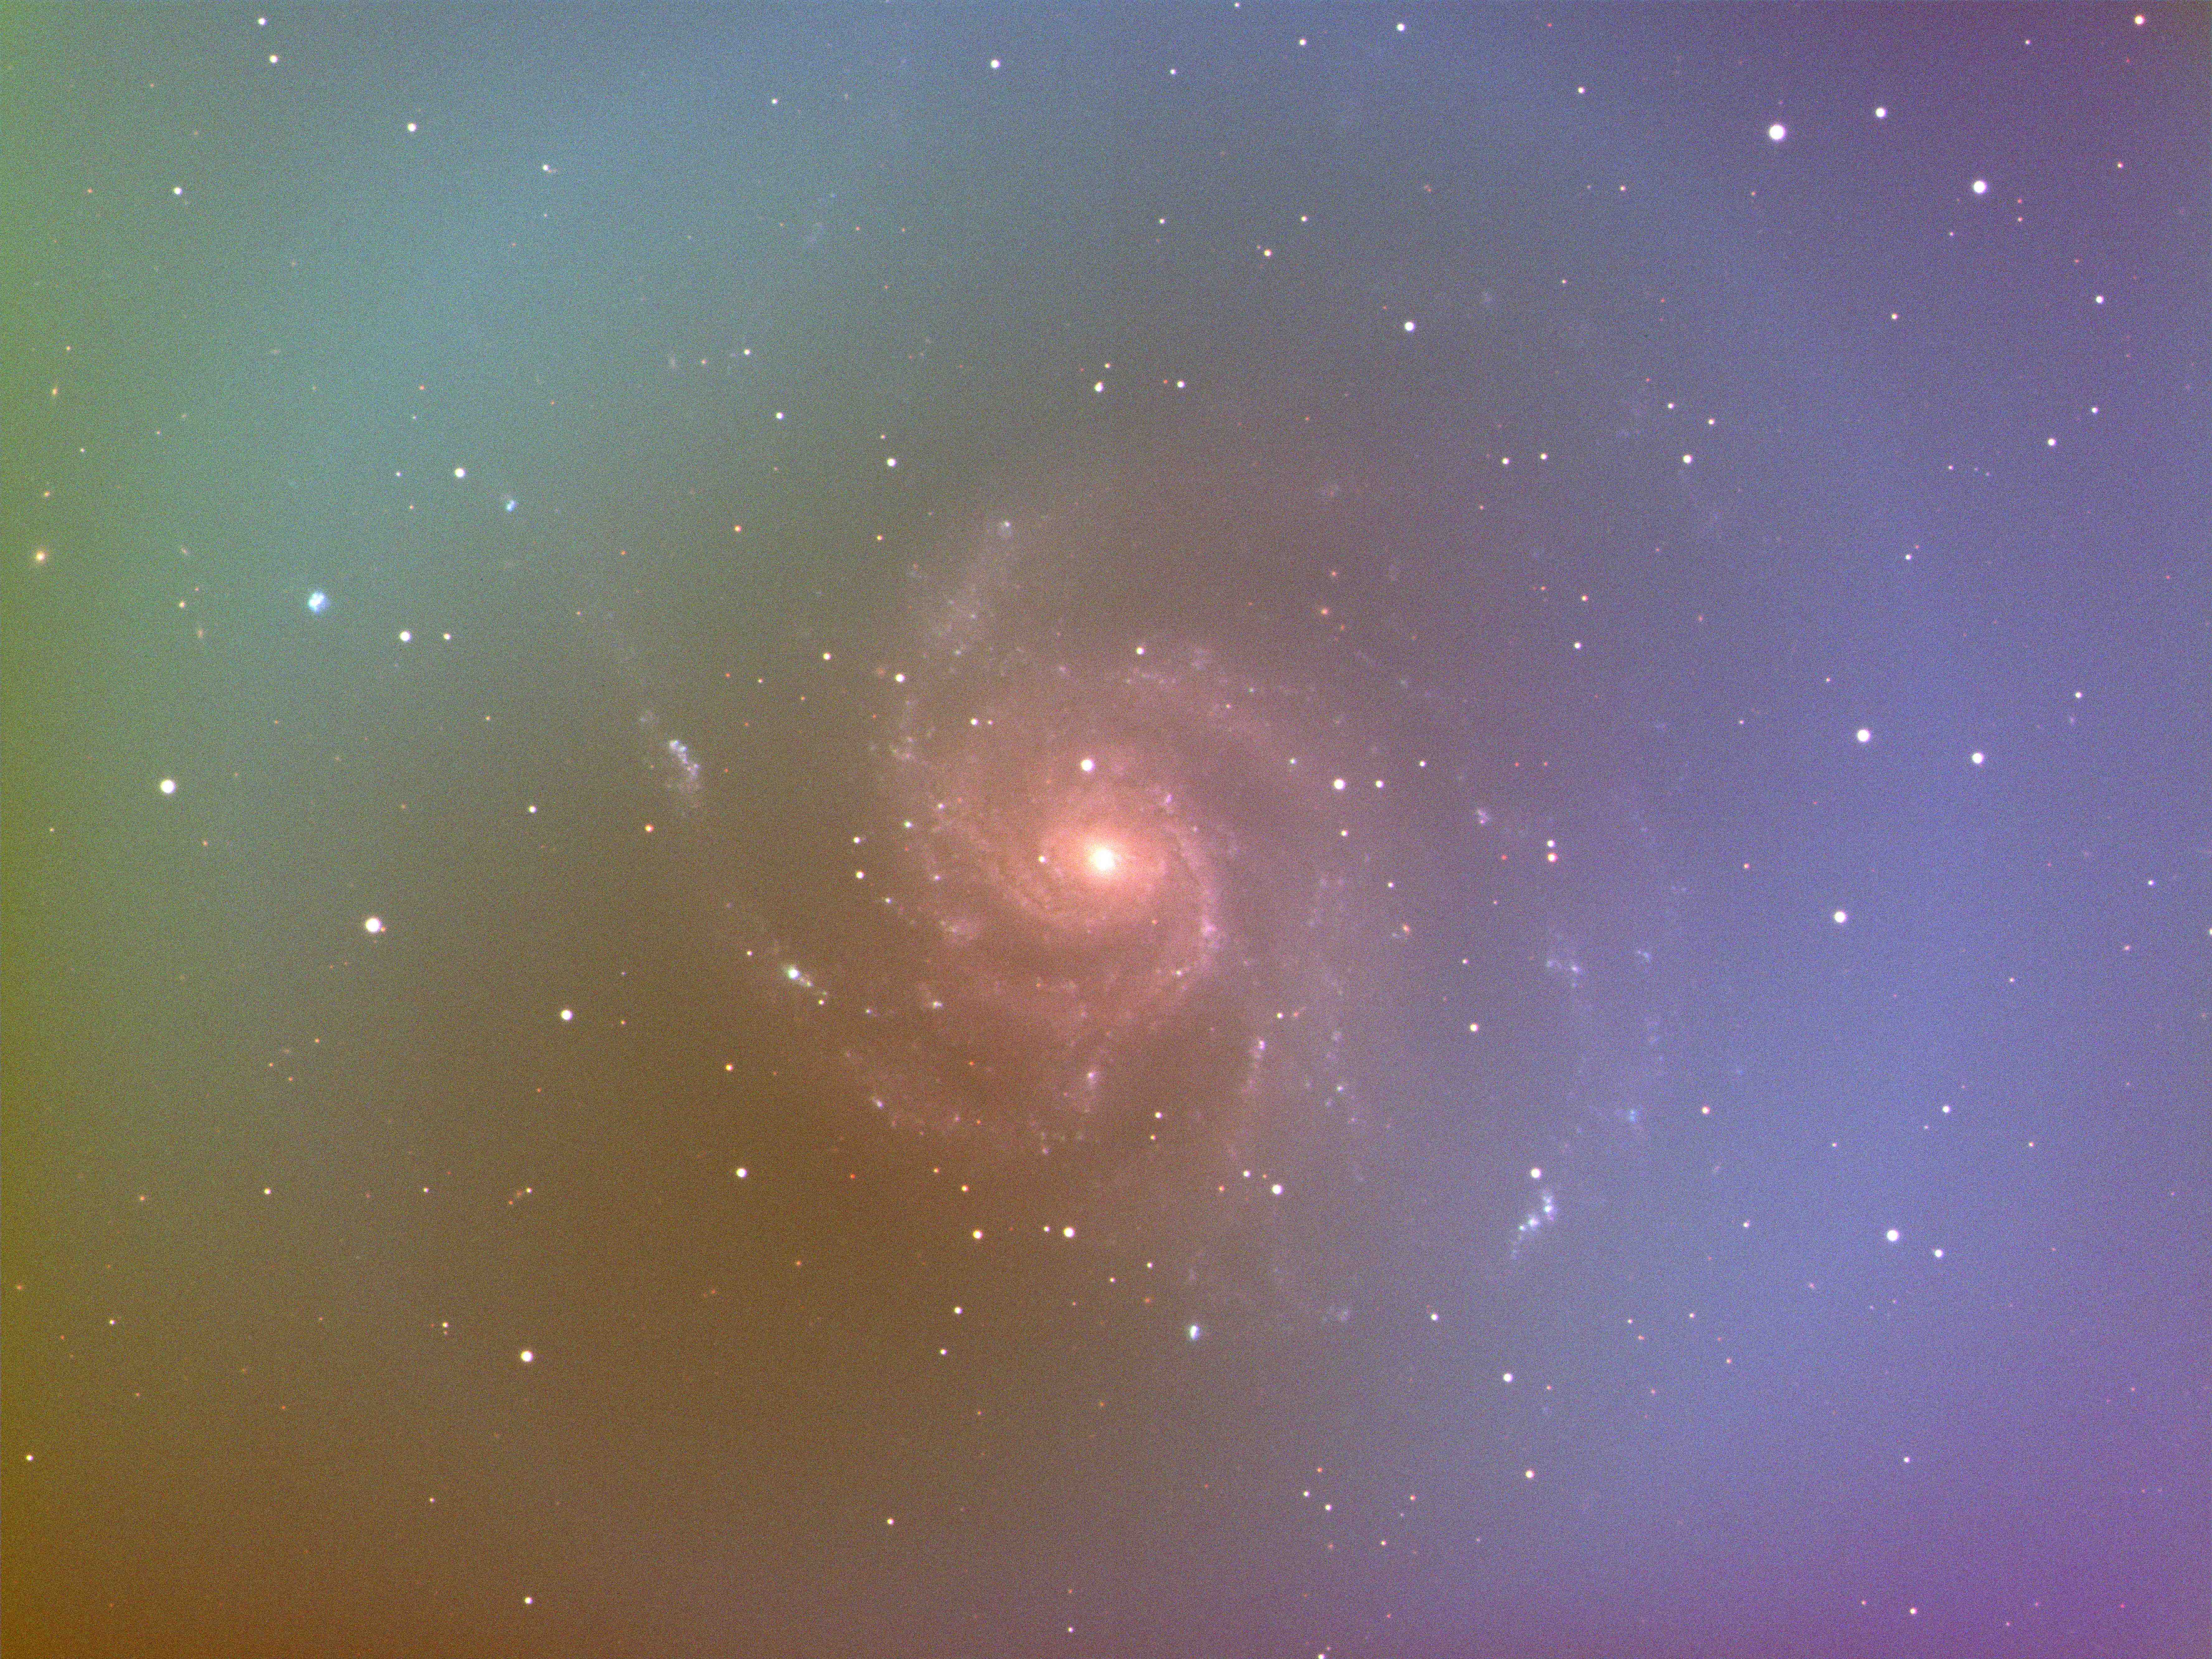
rgb = sdss_rgb([gimg_bkgsub, rimg_bkgsub, iimg_bkgsub], ['g', 'r', 'i'],
               scales={'g': (2, 0.9), 'r': (1, 1.0), 'i': (0, 1.0)}, m=0., Q=0.003)

fig, ax = plt.subplots(1, 1, figsize=(15, 8))
ax.imshow(rgb, origin='lower')
<matplotlib.image.AxesImage at 0x13f895fd0>
Discussion#
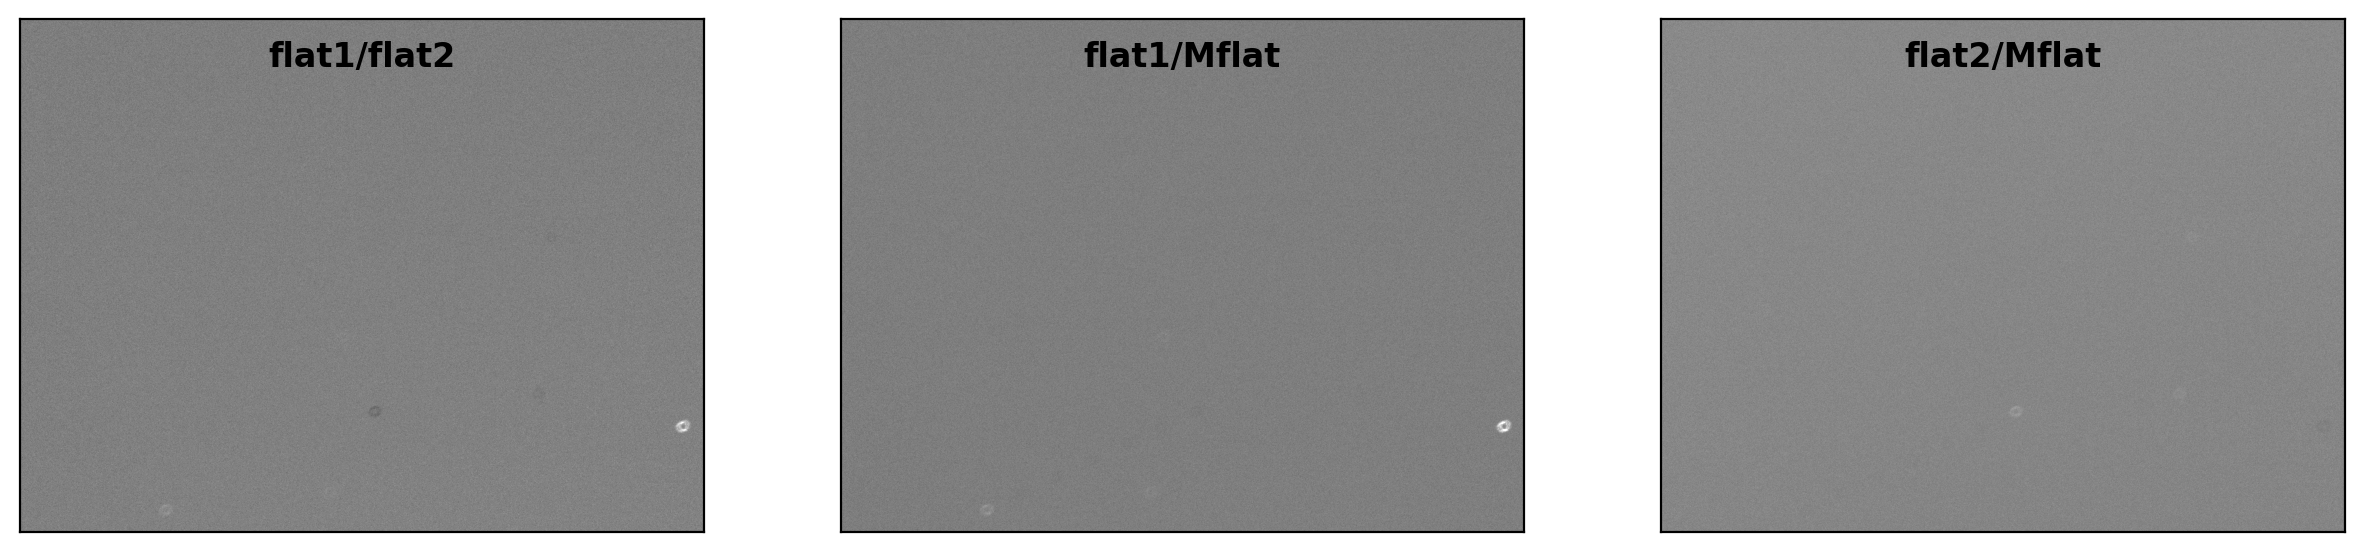
flat_table_g = flat_table[flat_table['filter']=='g']
flat1 = fits.getdata(RAWDIR / flat_table_g['filename'][0]) # first flat frame
flat2 = fits.getdata(RAWDIR / flat_table_g['filename'][-1]) # last flat frame
mbias = fits.getdata(OUTDIR / 'Mbias.fits')
mdark = fits.getdata(OUTDIR / 'MDark2.fits')
flat1 = flat1 - mbias - mdark
flat2 = flat2 - mbias - mdark
mflat = fits.getdata(OUTDIR / 'MFlatg.fits')
fig, axs = plt.subplots(1, 3, figsize=(15,6))
title = ["flat1/flat2", "flat1/Mflat", "flat2/Mflat"]
for i, img in enumerate([flat1/flat2, flat1/mflat, flat2/mflat]):
    ax = axs[i]
    vmin, vmax = interval.get_limits(img)
    ax.imshow(img, cmap='gray', origin='lower',
                vmin=vmin, vmax=vmax)
    ax.tick_params(axis='both', length=0.0,
                    labelleft=False, labelbottom=False)
    ax.text(0.50, 0.96, title[i], fontsize=12.0, fontweight='bold',
            transform=ax.transAxes, ha='center', va='top')
group = flat_table_g
fnames = [RAWDIR/f for f in group['filename']]
mdark_file = OUTDIR/f"MDark{group['exptime'][0]:.0f}.fits"
_ = make_mflat(fnames, mbias_file, mdark_file, verbose=False, plot=True)
INFO: splitting each image into 2 chunks to limit memory usage to 16000000000.0 bytes. [ccdproc.combiner]
This notebook is largely based on following references.
References
Useful manuals for preprocessing and more (based on IRAF)